
ETF flows can move crypto sentiment faster than price news. When money enters a spot fund, traders often read it as institutional demand. When money leaves for many sessions in a row, the same market can start treating every rally as liquidity that may be sold into.
That does not mean every outflow is bearish forever. ETF data is a map of demand, not a trading signal by itself. A useful crypto ETF flows guide should help you separate persistent allocation shifts from short-term risk reduction, rebalance activity, and price-driven AUM changes.
What Crypto ETF Flows Actually Measure
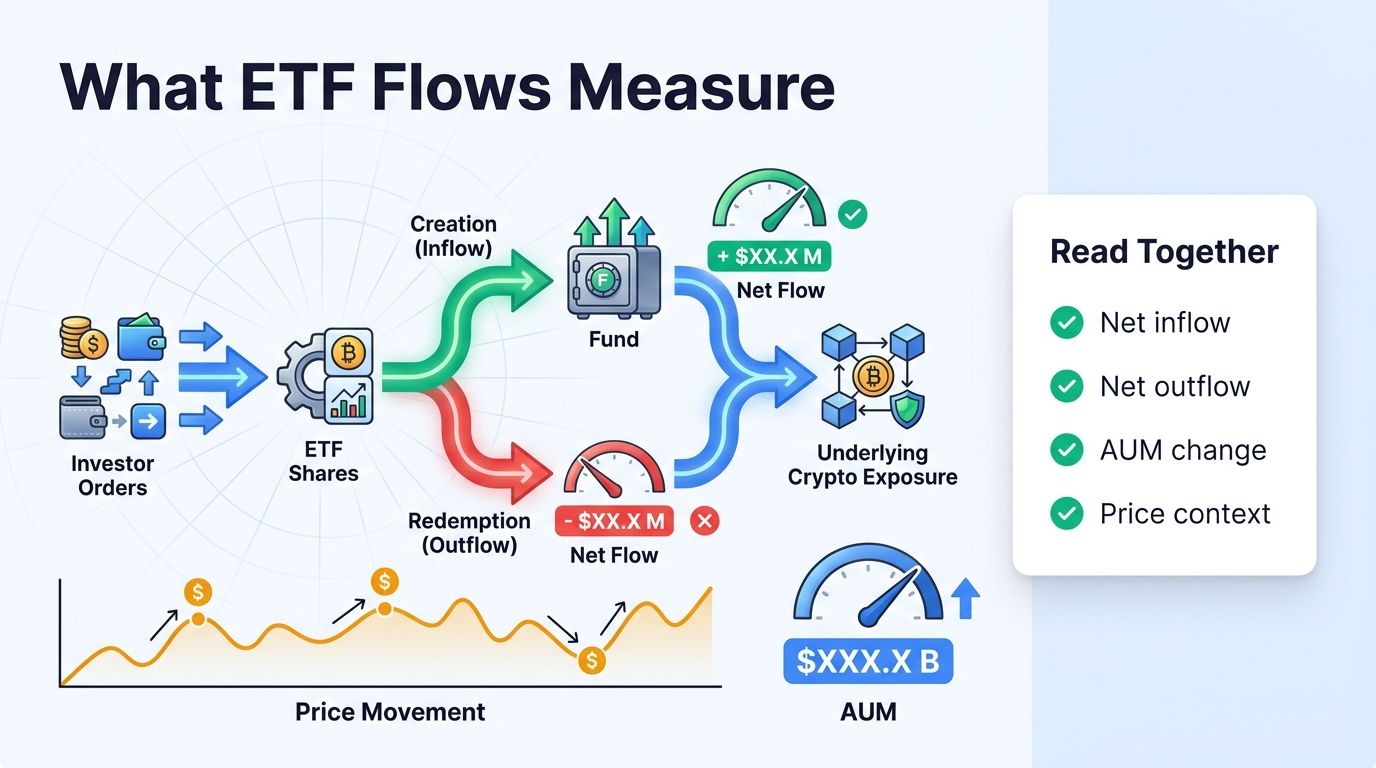
ETF flows track the net money entering or leaving exchange-traded funds. For spot crypto funds, that can translate into creation or redemption activity tied to the underlying asset. A Bitcoin ETF inflow may require new BTC exposure. An outflow can reflect shares being redeemed and exposure being reduced.
The important word is net. One issuer may receive money while another loses it. Price can also shrink total assets even when redemptions are modest. That is why traders should read flow, AUM, and price together instead of treating one number as the whole story.
- Inflows show fresh demand for fund exposure.
- Outflows show reduced fund exposure or rebalancing.
- AUM moves because of both flows and price changes.
- Issuer-level data matters when one fund dominates activity.
Why Early June 2026 Put ETF Flows Back in Focus
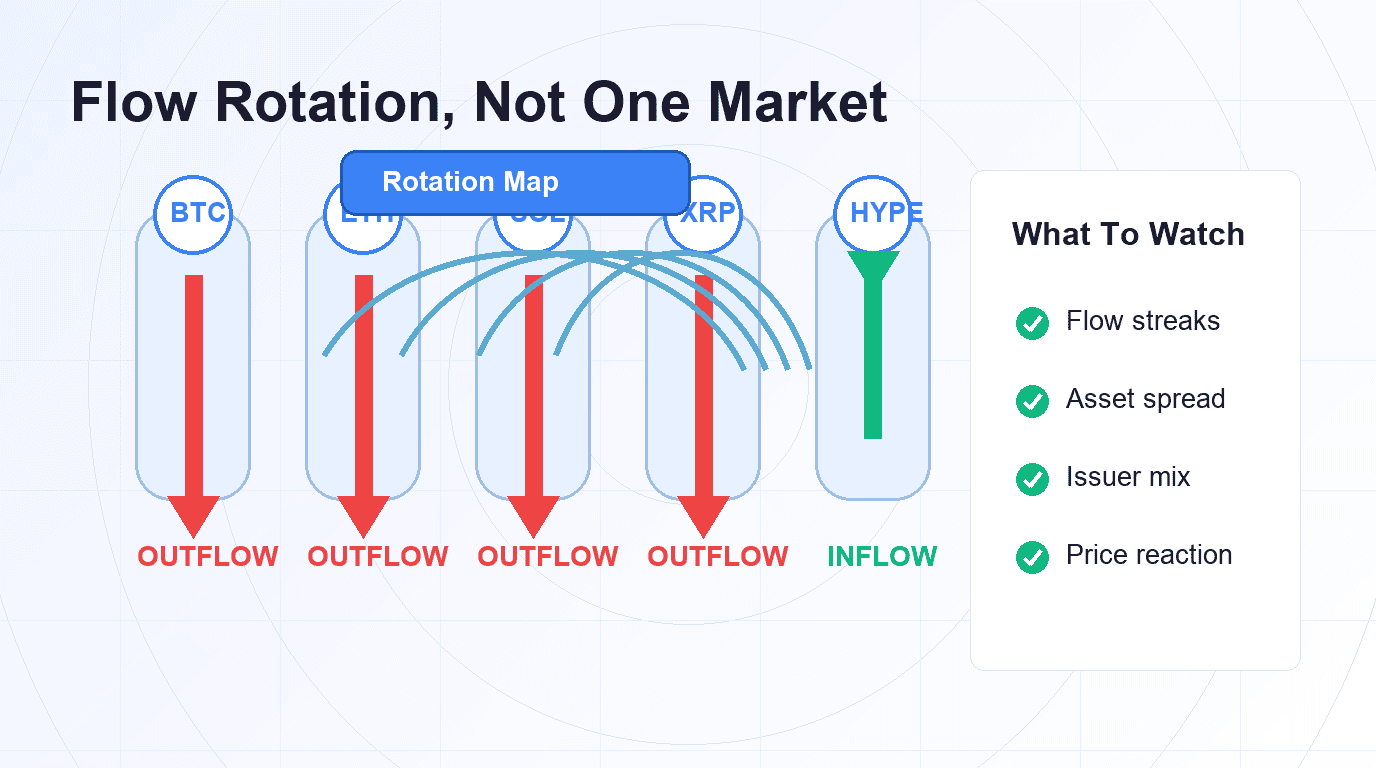
Early June 2026 gave traders a useful case study. CoinDesk reported that U.S. spot Bitcoin ETFs had logged 13 straight sessions of outflows by June 4, losing about $4.37 billion since mid-May. Ether, Solana, and XRP funds also joined the redemption wave, while HYPE-linked products were described as the rare major crypto ETF category still attracting steady inflows.
The lesson is not that one asset is automatically better than another. The lesson is that ETF flows can show rotation inside crypto, not only money entering or leaving the whole asset class. A broad outflow cycle can still contain pockets of demand.
- Look for streaks, not one isolated session.
- Compare major assets side by side.
- Watch whether altcoin flows confirm or resist Bitcoin flows.
- Treat small bright spots as rotation signals, not guarantees.
How Traders Can Use ETF Flow Data
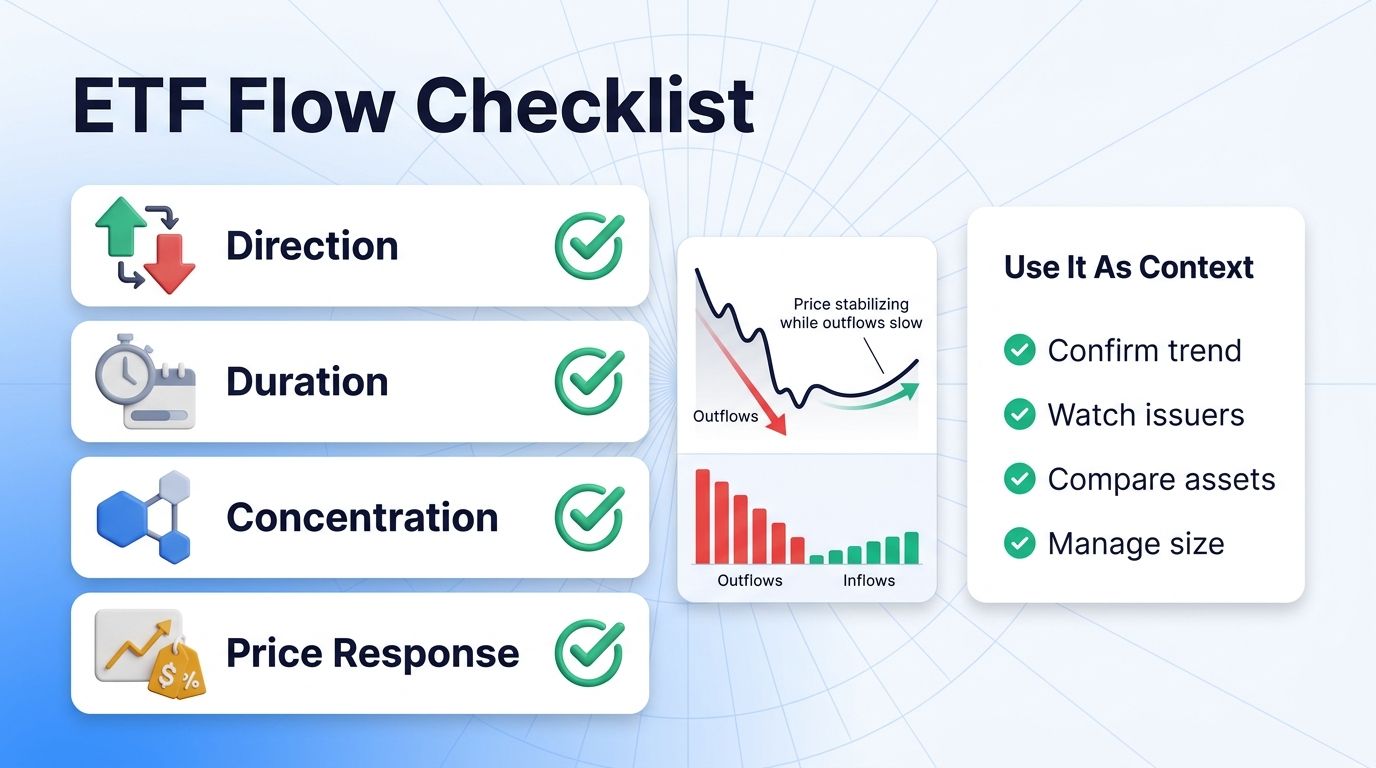
ETF flows are most useful as a context layer. A trader using Smart Trading, Grid bot, or Signal bot logic still needs entries, exits, invalidation, and position sizing. Flow data helps answer a different question: is institutional demand supporting the setup, fading from it, or rotating away from it?
A practical flow checklist starts with direction, duration, concentration, and price response. A single inflow after a long selloff may be noise. A multi-week trend across several issuers is more meaningful. If price stops falling while outflows continue, sellers may be getting absorbed. If price falls on smaller outflows, liquidity may be thin.
- Use flows for context, not blind entries.
- Confirm with structure, volume, and volatility.
- Size smaller when flows conflict with the trade.
- Avoid chasing delayed data after the move is obvious.
Common Mistakes When Reading ETF Flows
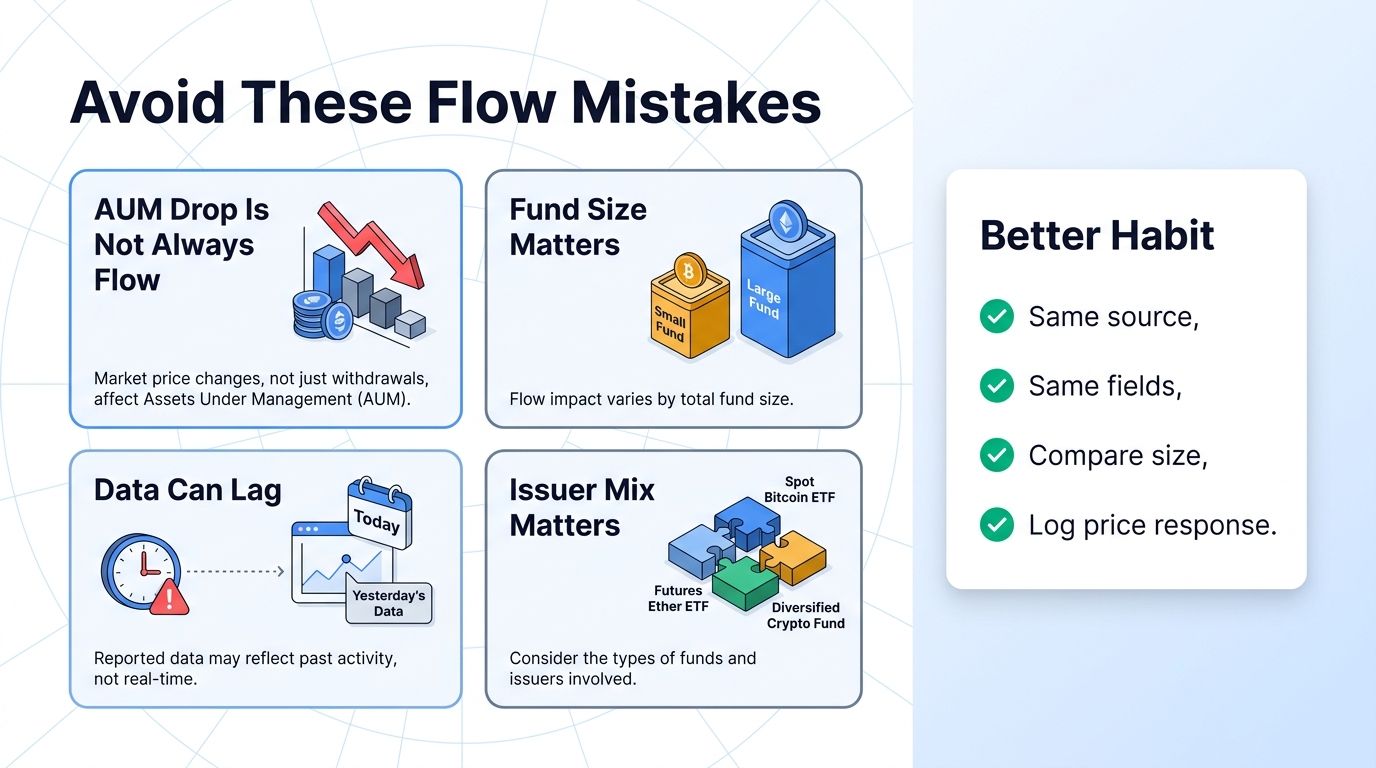
The biggest mistake is treating every outflow as forced selling. Some redemptions reflect portfolio rebalancing, tax management, or investors moving between issuers. Another mistake is ignoring the base effect. A large Bitcoin fund can print huge dollar outflows while a smaller altcoin fund shows a high percentage move from a much smaller base.
The cleaner approach is to build a habit. Check the same data source, compare the same fields, and record how price responded after the flow became public. Over time, this turns ETF flow data from a headline into a repeatable decision input.
- Do not confuse AUM drop with pure outflow.
- Do not compare dollar flow without fund size.
- Do not use delayed data as a real-time trigger.
- Do not ignore issuer concentration.
How to Turn Flows Into a Trading Routine
A practical routine starts before the chart. Pick one source for daily ETF flow data and review it at the same time each day. Write down the net flow by asset, the largest issuer contribution, and whether price moved with or against the flow. This creates a small decision journal that is more useful than reading flow headlines randomly.
Then connect that context to execution. If Bitcoin ETFs are seeing persistent outflows and BTC is below a key level, a trader may demand a stronger setup before taking a long position. If outflows slow while price stabilizes, the same trader may prepare for a relief move. The flow does not make the decision alone, but it changes how strict the setup needs to be.
This is where tools such as Smart Trading, Signal bot, Grid bot, and the Risk Reward Calculator become practical. ETF flow context helps with the market view. Execution tools help define entries, exits, automation boundaries, and position size. Mixing both keeps the article-level insight tied to actual trading behavior.
- Track the same flow fields every day.
- Write down price reaction after the flow print.
- Use stronger confirmation when flows fight the trade.
- Use risk controls before automation.
What Would Change the Signal
ETF flow signals change when the pattern changes. A single positive day after a long outflow streak is not enough on its own. A stronger shift would be multiple assets seeing inflows at the same time, several issuers participating, and price holding higher levels after the data becomes public.
The opposite also matters. If flows improve but price keeps falling, the market may be dealing with spot selling, derivatives pressure, or macro weakness that ETF demand cannot absorb. If flows are negative but price refuses to break down, sellers may be running out of power. The job is to compare flow, price, and volatility rather than worship one metric.
For 2026, the ETF market is broad enough that rotation is now part of the story. Bitcoin, Ether, Solana, XRP, HYPE, and future products can all show different demand profiles. The trader who only watches Bitcoin flows may miss the next internal shift inside crypto.
- Look for multi-day confirmation.
- Compare assets, not only Bitcoin.
- Check price response after the data.
- Treat rotation as a separate signal.
FAQ
Are crypto ETF inflows always bullish?
No. Inflows show demand for fund exposure, but price can still fall if broader market selling is stronger.
Why do ETF outflows matter for traders?
They show whether institutional fund demand is supporting or resisting a market move.
Should I trade only from ETF flow data?
No. ETF flows are a context layer. Use them with technical structure, volume, volatility, and risk controls.
What is the difference between ETF flow and AUM?
Flow measures net money entering or leaving. AUM also changes when the underlying asset price moves.