Most beginners stare at a candlestick chart and see noise. Pros see a real-time argument between buyers and sellers, with each candle revealing who is winning, who is exhausted, and where the next move likely starts. This guide breaks down exactly how to translate the four numbers behind every candle into a decision you can act on, using examples from Bitcoin, Ethereum, and the kind of charts you watch in Altrady every day.
What Is a Candlestick Chart?
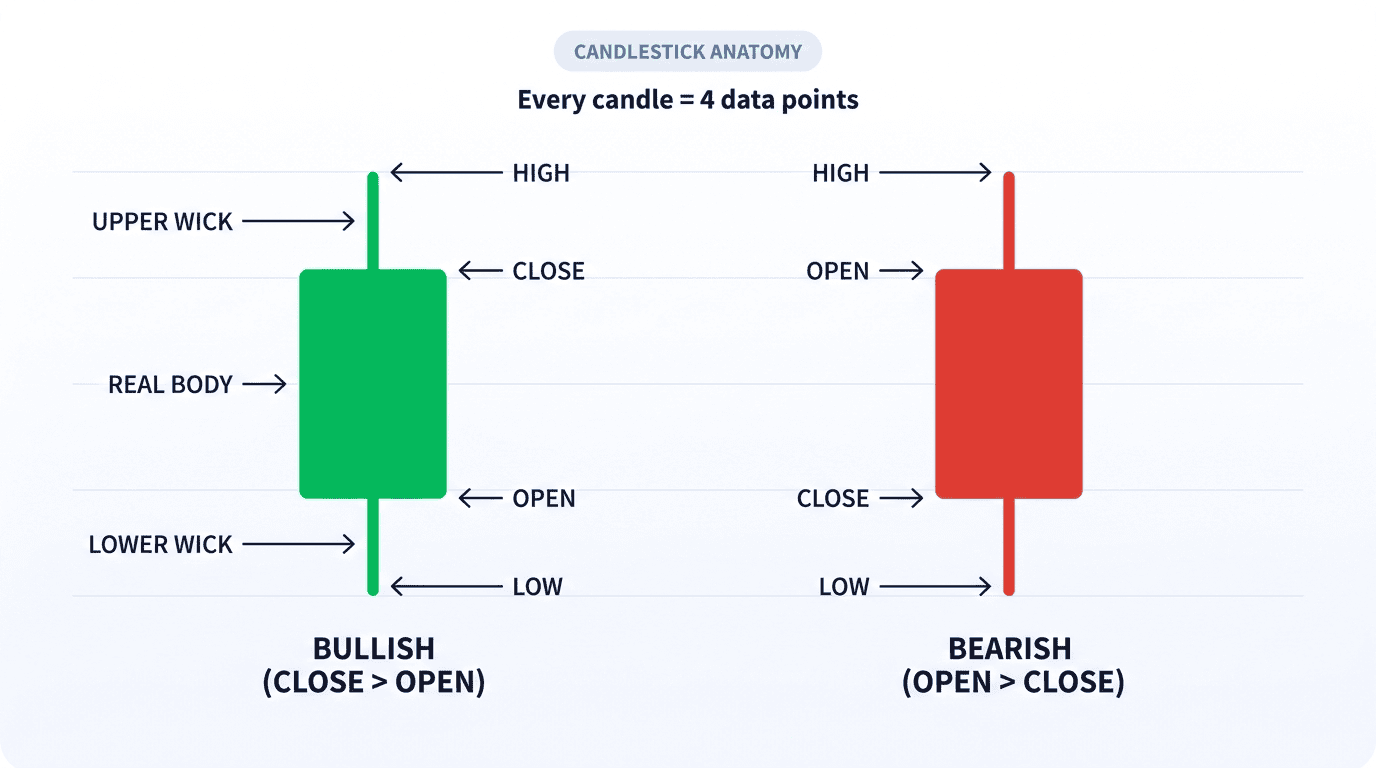
A candlestick chart shows price action across a fixed time interval (1 minute, 1 hour, 4 hours, 1 day, and so on). Every candle on the chart represents one of those intervals and packs four data points into a single shape: the open, the high, the low, and the close.
Compared to a line chart, which connects only closing prices, a candlestick chart shows you the full battle inside each interval, not just the result. That is why traders rely on it: the line chart tells you where price ended; the candle tells you how it got there.
Candlestick charts were developed in 18th-century Japan by rice trader Munehisa Homma. Western markets adopted them in the late 20th century, and today they are the default visualization on every serious crypto exchange, from Binance to Coinbase Pro to Bybit, and on charting tools like TradingView and Altrady.
The Anatomy of a Single Candlestick
Every candlestick has two parts:
1. The body (real body)
The thick rectangular part. The body shows the distance between the open and the close.
- If the close is higher than the open, the body is bullish (usually green or white).
- If the close is lower than the open, the body is bearish (usually red or black).
2. The wicks (shadows)
The thin lines extending above and below the body. Wicks show the extreme high and low reached during the interval before price snapped back to where it eventually closed.
- The upper wick marks the high of the interval.
- The lower wick marks the low of the interval.
A long upper wick means buyers pushed price up but sellers slammed it back down before close. A long lower wick means sellers pushed price down but buyers absorbed and pushed back. Wicks are rejection signatures.
How Bullish and Bearish Candles Look
A bullish candle has open at the bottom of the body, close at the top. Buyers controlled the interval. The longer the body, the stronger the buying pressure.
A bearish candle has open at the top of the body, close at the bottom. Sellers controlled the interval. Long red bodies indicate aggressive selling.
The color convention matters but is not absolute. On most platforms green = bullish, red = bearish. On classic Japanese charts white = bullish, black = bearish. Altrady lets you customize colors in the chart settings, but the structural meaning never changes: body up = buyers won, body down = sellers won.
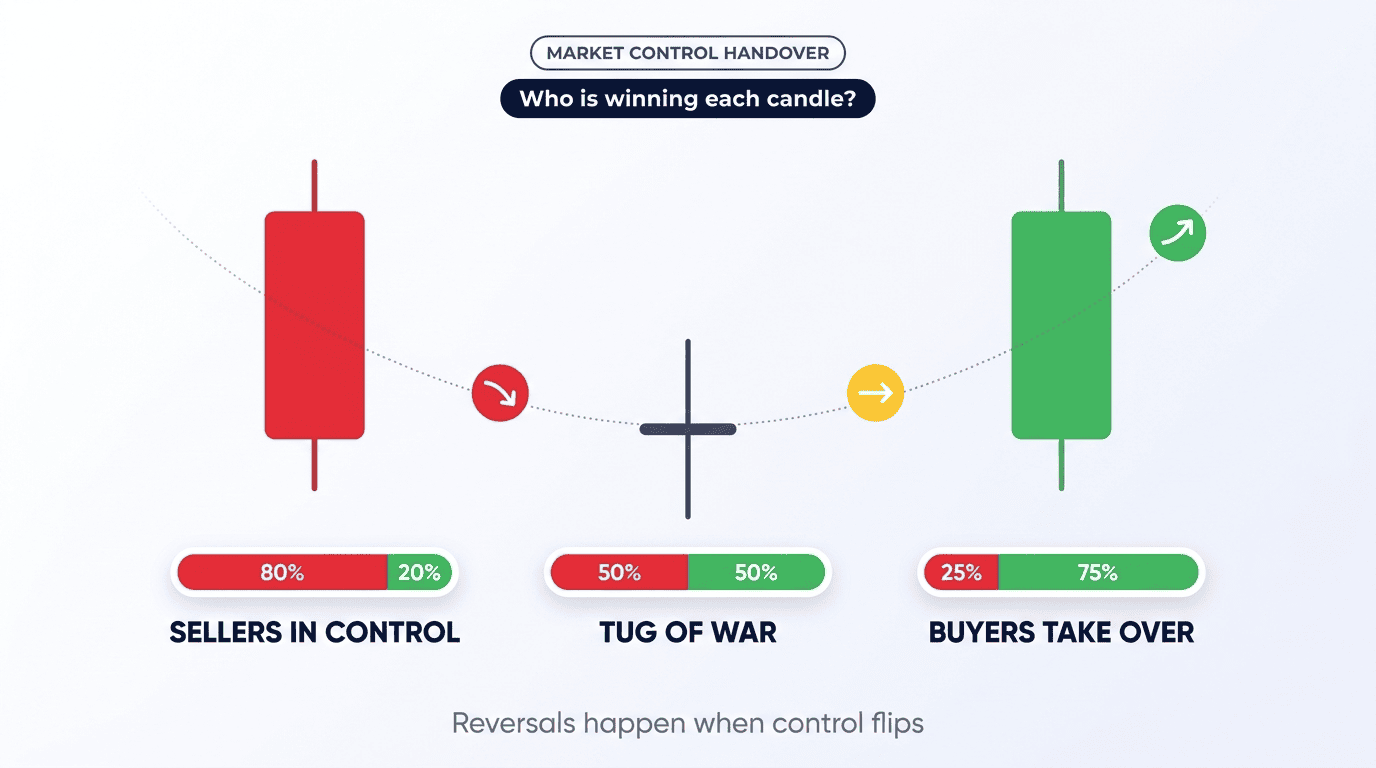
What Each Candle Reveals About Market Sentiment
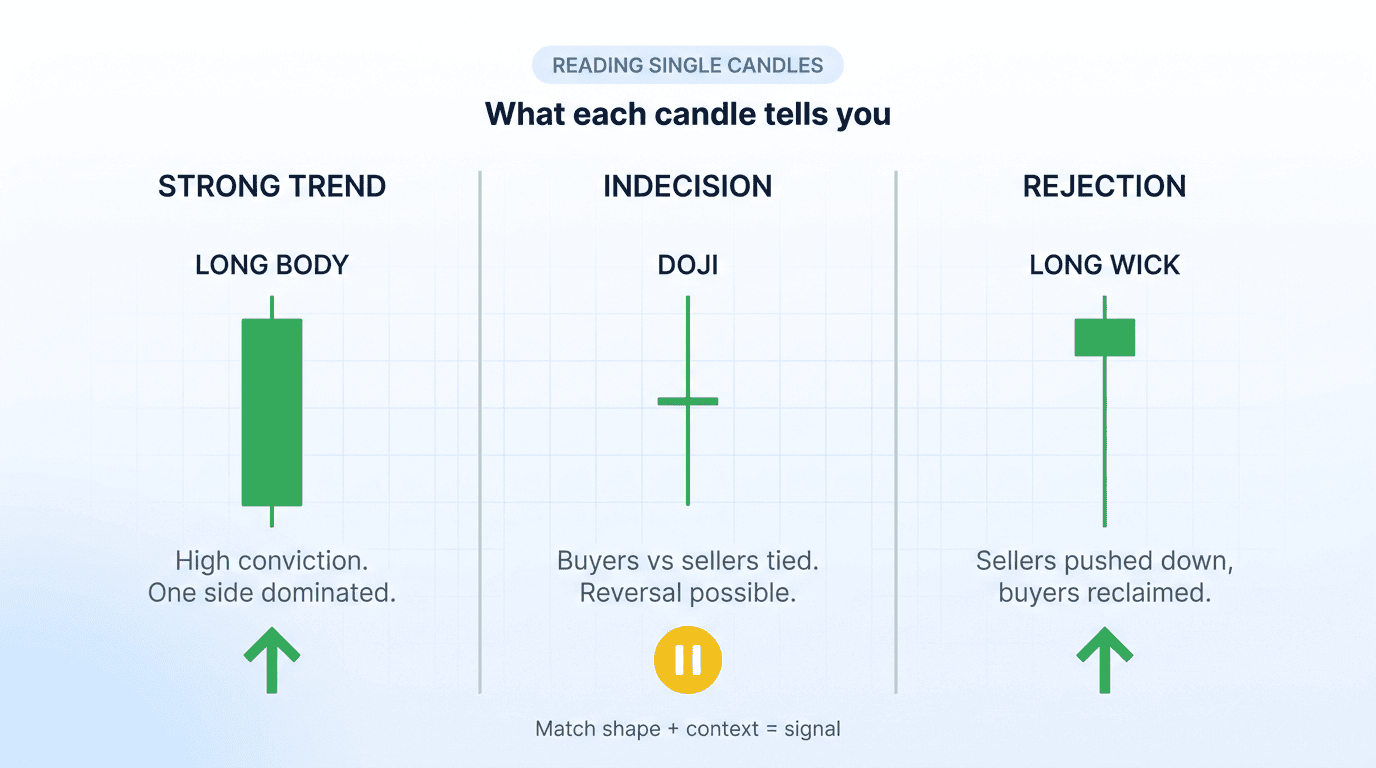
A single candle is a sentence. Read it carefully and it tells you who held control during the period and how confidently.
Long body, short wicks: One side dominated start to finish. High conviction. A long green body with tiny wicks on Bitcoin's daily chart usually means strong bullish momentum that is likely to continue at least one more candle.
Small body, long wicks on both sides: Indecision. Buyers and sellers fought to a draw. Both sides reached extremes but neither held them. This is the classic doji shape, and it often appears at potential reversal points.
Small body, long lower wick only: Sellers pushed down hard but got rejected. Buyers stepped in and reclaimed most of the loss before close. Bullish if it appears after a downtrend.
Small body, long upper wick only: Buyers pushed up hard but got rejected. Sellers absorbed and dragged price back down before close. Bearish if it appears after an uptrend.
No wicks, full body: Called a marubozu. Pure trend candle. One side controlled the entire interval without giving up any ground.
Reading Sequences: How Multiple Candles Tell a Story
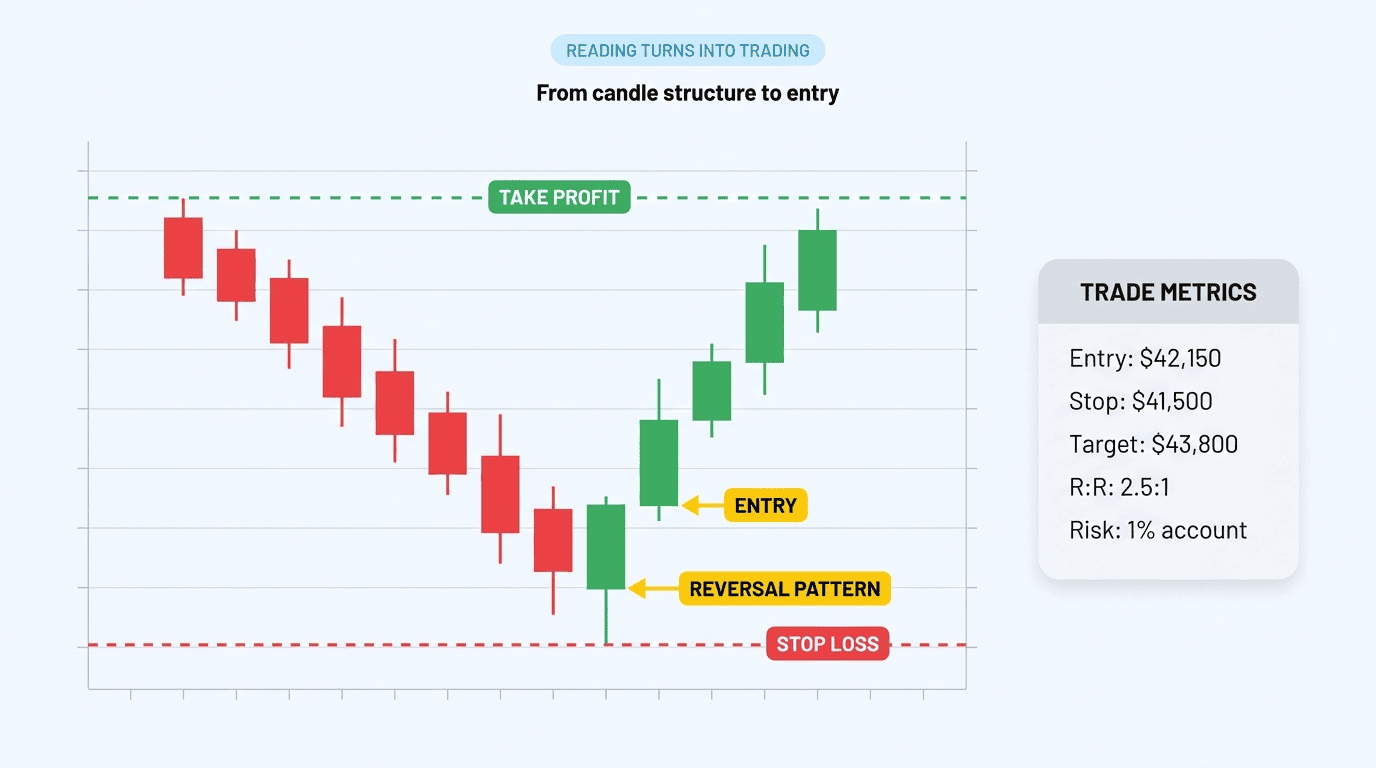
Single candles give you a snapshot. Multi-candle sequences give you the narrative arc. This is where candle reading turns from vocabulary into actual trading skill.
Trend continuation: Five or six green candles in a row, each making a higher high and higher low. Buyers are in firm control. Pull-backs are shallow, and any red candle is small.
Trend exhaustion: Strong trend that suddenly produces a candle with a long upper wick (in an uptrend) or long lower wick (in a downtrend). The wick says the prevailing side reached its limit and got rejected. Watch the next candle.
Reversal pattern: Two or three candles forming a recognizable shape. A bearish engulfing pattern, a bullish hammer, a morning star, or a hanging man each tell a specific story about who lost control and who took over.
If you want to dig into individual reversal patterns, Altrady has dedicated guides on the doji, hammer, bullish engulfing, and hanging man patterns. Master one at a time rather than trying to memorize 50 names.
Why Timeframe Changes Everything
The same candle shape on a 1-minute chart and a 1-day chart are not the same signal.
A bullish hammer on the 1-minute chart of BTC means buyers stepped in for 60 seconds. That is barely meaningful given normal market noise.
A bullish hammer on the 1-day chart of BTC means buyers stepped in across 24 hours of global trading volume. That is a signal worth respecting.
Higher timeframes carry more weight because they aggregate more information. As a rule:
- 1m / 5m / 15m: scalping, intraday entries, noise-heavy
- 1H / 4H: day trading and swing entries
- 1D / 1W: swing trading, position trading, macro structure
If you are new to candlestick charts, start with the daily timeframe. The signals are clearer, the noise is filtered, and you have time to think between candles. Drop down to lower timeframes only after you can confidently read the daily.
Common Beginner Mistakes When Reading Candlestick Charts
1. Trading every candle in isolation. A red candle is not a sell signal by itself. Look at the candles before it and after it. Context decides whether a single candle means anything.
2. Ignoring volume. A bullish engulfing pattern on low volume is much weaker than the same pattern on a volume spike. Always check the volume bar underneath the candle.
3. Mixing up "rejection" with "momentum". Long wicks mean rejection. Long bodies mean momentum. A long green body is bullish strength. A long lower wick on a tiny body is also bullish, but it means buyers fought back from a loss, not that buyers cruised. Different stories, different setups.
4. Forcing patterns where none exist. After learning a pattern, beginners see it everywhere. Most of the time the candles are just random shapes. A pattern only counts if it appears at a meaningful level (support, resistance, prior swing, fib retracement) and is confirmed by the next candle's close.
5. Trading the lowest timeframe. 1-minute candles are mostly noise. The deeper your timeframe, the cleaner the signal.
How to Practice Reading Candlestick Charts in Altrady
Reading skill compounds through reps. The fastest way to build it is to scan many charts daily, compare what the candles told you against what actually happened next, and adjust your reading.
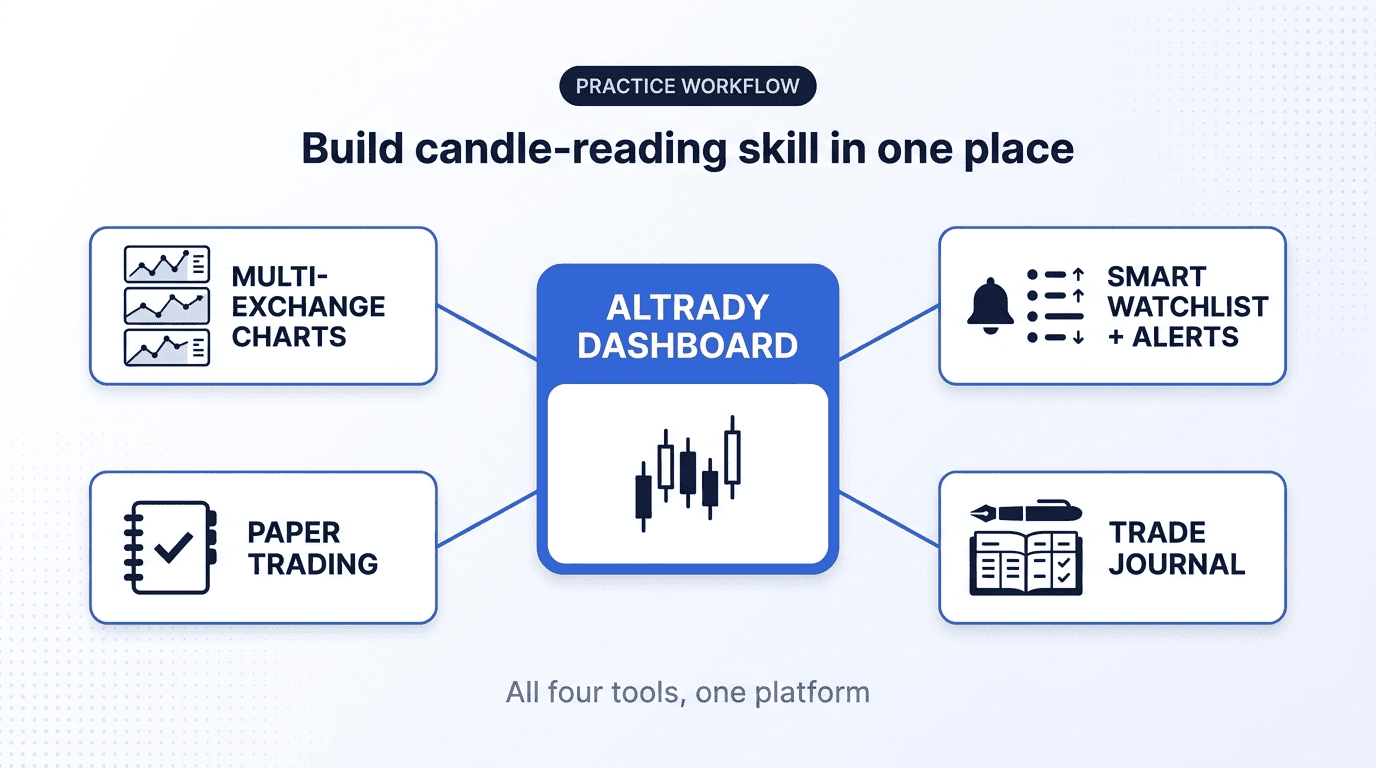
Inside Altrady, that workflow looks like this:
- Multi-exchange chart view: pull up BTC/USDT, ETH/USDT, and a few alts side by side. Same timeframe across all. Notice when candle structures match across coins (sector-wide signal) versus when one coin diverges (idiosyncratic move).
- Smart Watchlist with technical alerts: tag your favorite pairs. Set alerts on key candle events such as "close above resistance" or "long lower wick rejection at support." When an alert fires, the chart is already loaded.
- Paper trading account: practice reading without risking real capital. Fire trades based on what the candles tell you, then review. Most readers underestimate how often they misread; paper trading exposes that fast.
- Trade journal: every trade you take should record what candle pattern triggered it and what the outcome was. After 50 trades you can statistically tell which candle reads work for you and which don't.
Frequently Asked Questions
What is the best timeframe to read candlestick charts?
Daily charts give the cleanest signals for most traders. Use 4-hour for swing entries and 1-hour for day trading. Avoid 1-minute charts until you can confidently read higher timeframes.
Do candlestick patterns work in crypto markets?
Yes. Crypto markets respect candlestick patterns the same way forex and stocks do because the patterns reflect human psychology around fear, greed, and decision points, which is universal. The main difference: crypto's 24/7 nature means you cannot rely on session opens or daily settles the way you can in equities.
How accurate are candlestick patterns?
Individual patterns hover around 50-60% reliability when used in isolation. Combining patterns with key support/resistance levels, volume confirmation, and trend context can push reliability above 70%. No pattern guarantees a winning trade, which is why position sizing and stop-losses matter.
Should I memorize every candlestick pattern?
No. Master five or six high-impact patterns first: hammer, shooting star, doji, bullish engulfing, bearish engulfing, and morning/evening star. These cover most actionable reversals. Add more patterns to your toolkit only after you can trade the core ones profitably.
Can I automate trades based on candlestick patterns?
Yes, but with caution. Most candlestick patterns require context to be reliable, and pure pattern recognition without trend filter and volume confirmation produces a lot of noise. If you automate, build the pattern detection alongside trend, volume, and key-level filters.
Final Thoughts
Reading candlestick charts is not about memorizing 50 patterns. It is about understanding what every candle tells you in real time: who is in control, how strongly, and whether they are likely to keep control. Once you internalize the four data points per candle and the six or seven core patterns, the chart stops being noise and starts reading like a story.
The fastest way to build the skill is reps inside a single workflow. Open Altrady, watch a few pairs across timeframes, set alerts on patterns you want to study, and journal every trade you take. After a month of focused practice, you will look at a chart and immediately see what beginners cannot.
Ready to put it into practice? Start your Altrady free trial and use the multi-exchange charts, technical alerts, and paper trading account to build candle-reading skill without risking capital.