The wisdom of Larry William about financial markets has enabled him to develop an advanced conceptualization of the price movements of an asset, especially, from the standpoint of how the forces between buyers and sellers battle. For cryptocurrencies, his concepts still work as their fundamentals remain intact.
Williams' indicators and their trustworthiness are current evidence of his techniques as an advanced degree to approach the markets. He was tested at the 1987 World Cup Championship of Futures Trading, where he won the championship with a ground-breaking 11,300% return, turning his initial balance of $10,000 to $1,100,000 during the 12-month competition.
This article overviews his indicators and possible strategies to apply in the crypto markets.
Larry Williams Strategy
Larry Williams' set of strategies comprises multiple principles and techniques that address well-known concepts among traders, such as support as a reflection of a demand zone and resistance as an indication of supply areas.
Larry Williams employs those concepts in a procedure that takes them to other levels of comprehension and application in the markets. Beyond the typical understanding, he establishes a strict correlation between how buyers and sellers interact around support and resistance and how the price of an asset finally moves towards a specific direction, to the upside or downside.
For Larry Williams, what causes price oscillations is the battle between buyers and sellers to accomplish a desire to make a profit by striving for a specific zone entry with an expectancy of exiting in another particular zone.
Two things we can point out from the last paragraph:
- That means the desire on the buy-side when strong enough forces the market participant to be involved in a rush of immediate acquisition of an asset.
- The desire on the sell-side when strong enough forces the market participant to be involved in a hurry for the immediate release of their holdings.
Simply put:
- When a buyer wants a position they will pay the immediate market price.
- When a seller wants to release a position, will accept the current market price.
This battle between buyers and sellers is the basis for understanding how Williams' indicators work and the measurement they perform ahead of multiple events in the market, especially the crypto one, such as
- Liquidity runs
- Sell-offs
- Volatility Spikes
- Bullish Momentum
- Market Sentiment Shifts
Larry Williams' Indicators For Crypto Trading

The principles for understanding the buyers and sellers interaction and how they act as catalysts for massive rallies in the market in either direction, which intrinsically influences volatility, thus market sentiment and momentum, enable traders to spot repeated movements and through indicators, they can gain conviction to execute trades.
It is indeed a cycle that repeats, from where patterns emerge, leaving a window for traders to exploit opportunities. How can traders enhance their performance by using the Williams' indicators? Let's see.
The ultimate oscillator
The oscillator is a momentum indicator designed to measure the price momentum of an asset across multiple timeframes.
Williams Sentiment Index
Traders can use this indicator to determine levels of market sentiment during a trading period.
It is an oscillator with two levels, 75 and 25:
- When the indicator reading is above 75, the market may be bearish.
- When it drops below 25, the market may be bullish.
Williams Volatility Channel
The indicator is a channel with upper and lower bands, with the gap between the bands indicating the levels of market volatility.
- When there is high volatility, the gap widens and
- When volatility is low, the gap diminishes.
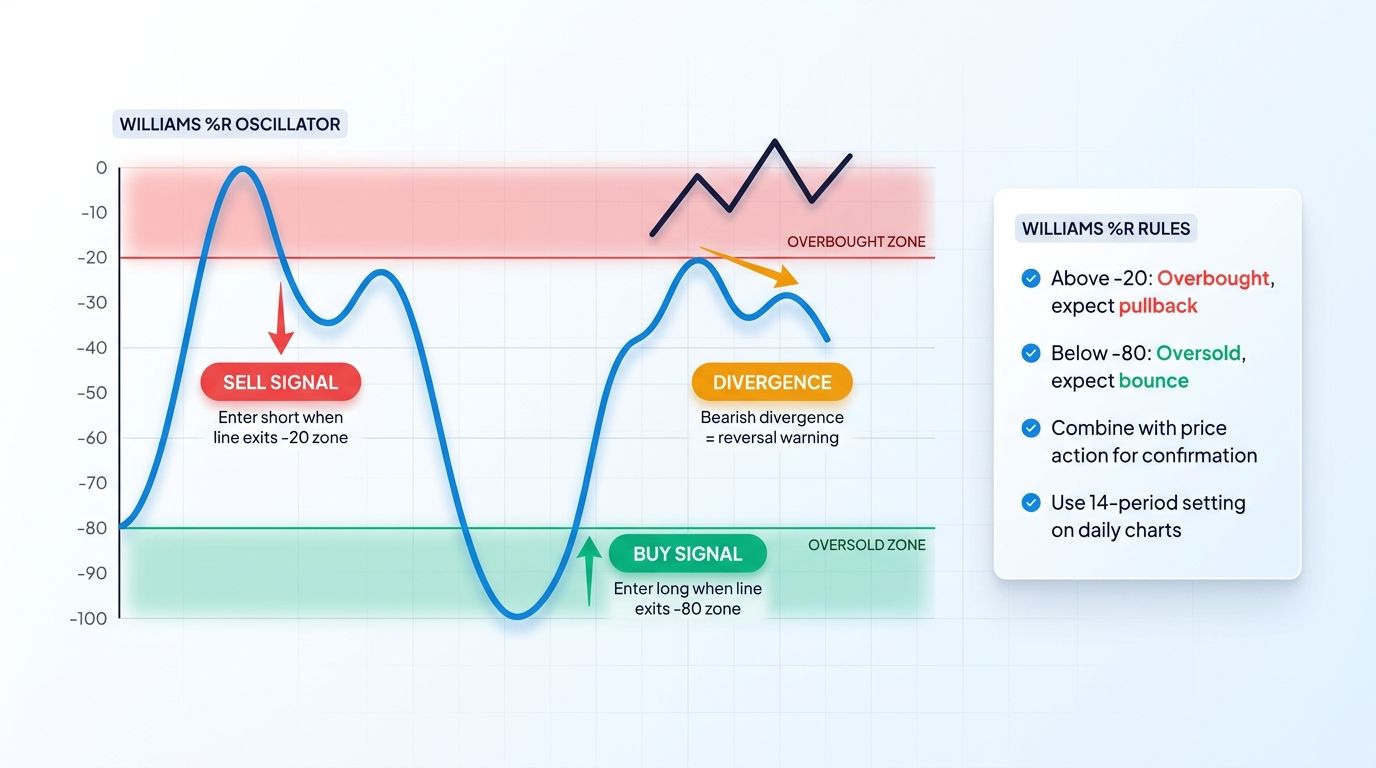
Williams %R
This is a momentum-based indicator that fluctuates between a 0 and -100 line. It helps traders to identify overbought/oversold conditions in the market.
It can be used as an entry and exit tool in the market:
- A reading between -20 and 0 is considered overbought a
- A reading of -80 and -100 is considered oversold.
Williams Money Flow Index
The Williams MFI shows when institutional traders are buying or selling It can be helpful as a timing tool for entry and exits.
- A high index reading indicates an accumulation phase and that a rally is imminent.
- While a low index reading denotes a market distribution phase.
Williams Insider Accumulation Index.
This indicator works similarly to the Williams MFI. It helps remove volume which can be misleading information.
It measures the buying and selling of large institutions and shows similar signals generated by the Williams MFI.
Liquidity Runs Strategy
This strategy can be apprehended as an anteroom for breakout movements.
Typically, institutional traders induce these runs as they need to play with liquidity to fill their position sizes.
By using the Williams Money Flow Index, traders can spot:
- Accumulation phases before a rally.
- Distribution phases that suggest low institutional participation.
Sell-offs And Bullish Momentum Strategy
Bullish momentum can take place during prolonged trends after a pullback.
With Williams R%, traders can detect a potential continuation (momentum) of the prevailing trend by reading an oversold level in a market pullback as the indicator suggests:
- A reading of -80 and -100 is considered oversold.
Now, during a prolonged uptrend, sell-off movements can take place for downside reversal moves. Typically, sell-off movements are faster than bullish momentum since the panic sentiment tends to be stronger than the optimism.
Williams R% can also help traders detect a potential downside reversal momentum by spotting an overbought level:
- A reading between -20 and 0 is considered overbought.
Conclusion
Larry Williams' set of indicators addresses the markets from a variety of stances that permit traders to exploit multiple opportunity windows. Most of these indicators are based on his understanding of the market and how buyers and sellers determine volatility, market sentiment, directional moves, etc.
In Altrady, crypto traders use some of his indicators such as the Williams %R to detect and exploit market opportunities. Sign up for a free trial account today.