
The candlestick library has hundreds of named patterns. You will never use most of them. The 10 patterns in this guide are the ones that show up over and over on BTC, ETH, and altcoin charts, and the ones with enough historical reliability to actually trade. Master these, ignore the rest, and your candle reading will outperform 90 percent of traders who try to memorize 50 shapes at once.
Why Only 10 Patterns
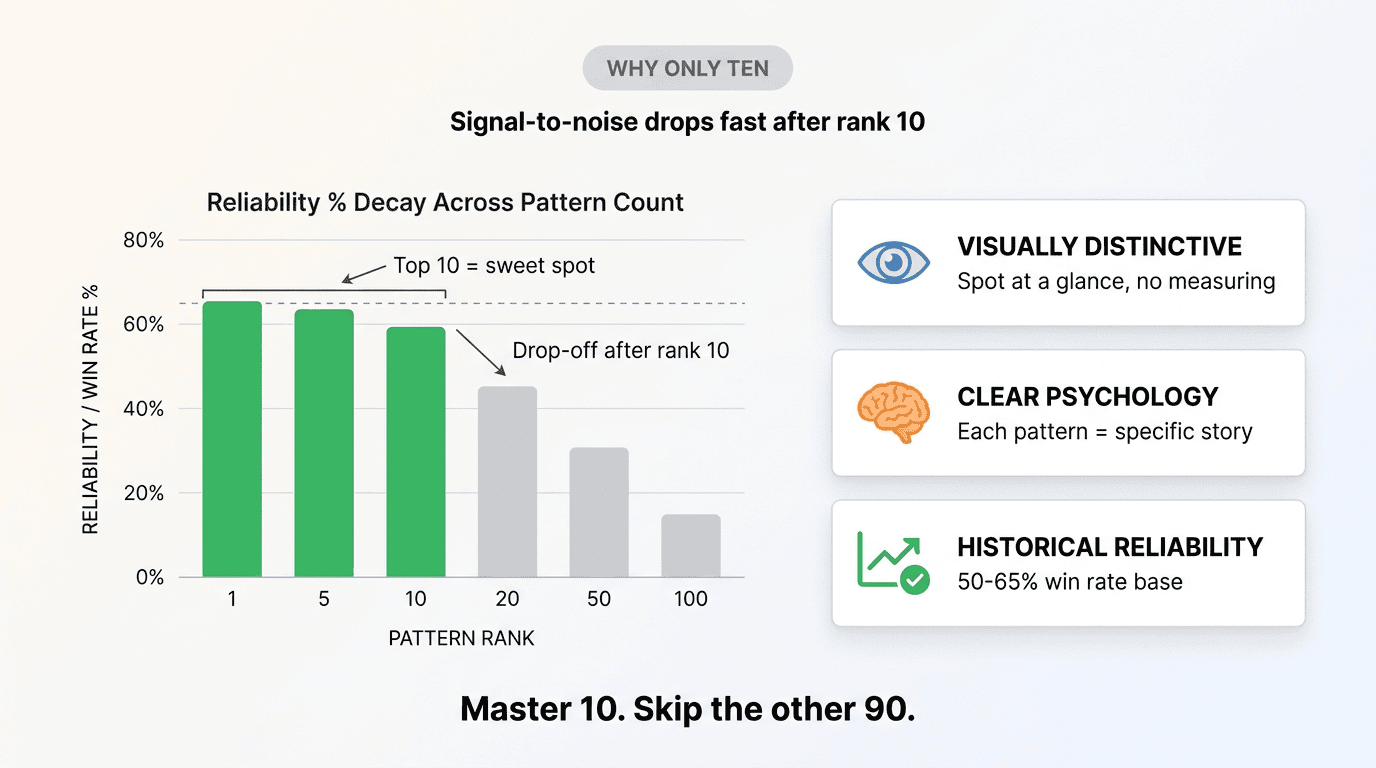
Statistical studies of candlestick reliability (Bulkowski, Nison, and others) consistently rank the same handful of patterns at the top. The signal-to-noise ratio drops fast after the top 10. Adding the 20th pattern to your toolkit barely improves win rate but doubles the cognitive load of scanning charts.
Pros use a small set of patterns relentlessly. The 10 patterns below cover both reversal and continuation, both bullish and bearish, and they all share three traits that make them tradable:
- Visually distinctive. You can spot them at a glance, no measuring required.
- Clear psychological narrative. Each one tells a specific story about who lost control and who took over.
- Backed by historical reliability. Each pattern has a 50-65 percent win rate in isolation, climbing higher with confirmation and context.
Now let's walk through them, ordered roughly by how often you will see them on crypto charts.
1. Hammer
A small body at the top of the range, a long lower wick at least 2x the body length, and little or no upper wick. The hammer appears at the bottom of a downtrend and signals a potential bullish reversal.
Psychology: Sellers pushed price down hard during the period. Buyers stepped in, absorbed the selling, and reclaimed most of the loss before close. The long lower wick is the visible signature of that absorption.
How to trade: Wait for the next candle to close above the hammer's high before entering long. Stop-loss goes below the hammer's low. The hammer candlestick pattern works best at major support levels and after a clear downtrend.
2. Hanging Man
Identical shape to the hammer, but appears at the top of an uptrend instead of the bottom of a downtrend. The hanging man candlestick pattern signals a potential bearish reversal.
Psychology: Even though buyers reclaimed the loss, the fact that sellers were able to push price down sharply during a strong uptrend is a warning. The buyers are getting tired.
How to trade: Confirmation is critical. Wait for the next candle to close below the hanging man's body before shorting. Without confirmation, the hanging man often resolves as continuation, not reversal.
3. Bullish Engulfing
A small bearish candle followed by a larger bullish candle that completely engulfs the prior body. The bullish engulfing pattern is one of the strongest reversal signals on the chart.
Psychology: The first candle confirms the existing downtrend. The second candle opens at or below the first close (gap or flat) and closes above the first open. Buyers did not just defend; they reclaimed every inch of the previous period and more.
How to trade: Enter long at open of the candle after the engulfing pair, stop-loss below the engulfing low, target prior swing high or 1:2 R:R minimum. Volume on the second candle should be elevated.
4. Bearish Engulfing
Mirror image of bullish engulfing. A small bullish candle followed by a larger bearish candle that engulfs it. Appears at tops, signals bearish reversal.
Psychology: Sellers came in with overwhelming force, erasing the prior period's gains and more. The deeper the engulfing candle, the stronger the reversal signal.
How to trade: Same logic as bullish engulfing in reverse. Short below the engulfing close, stop above the engulfing high.
5. Doji
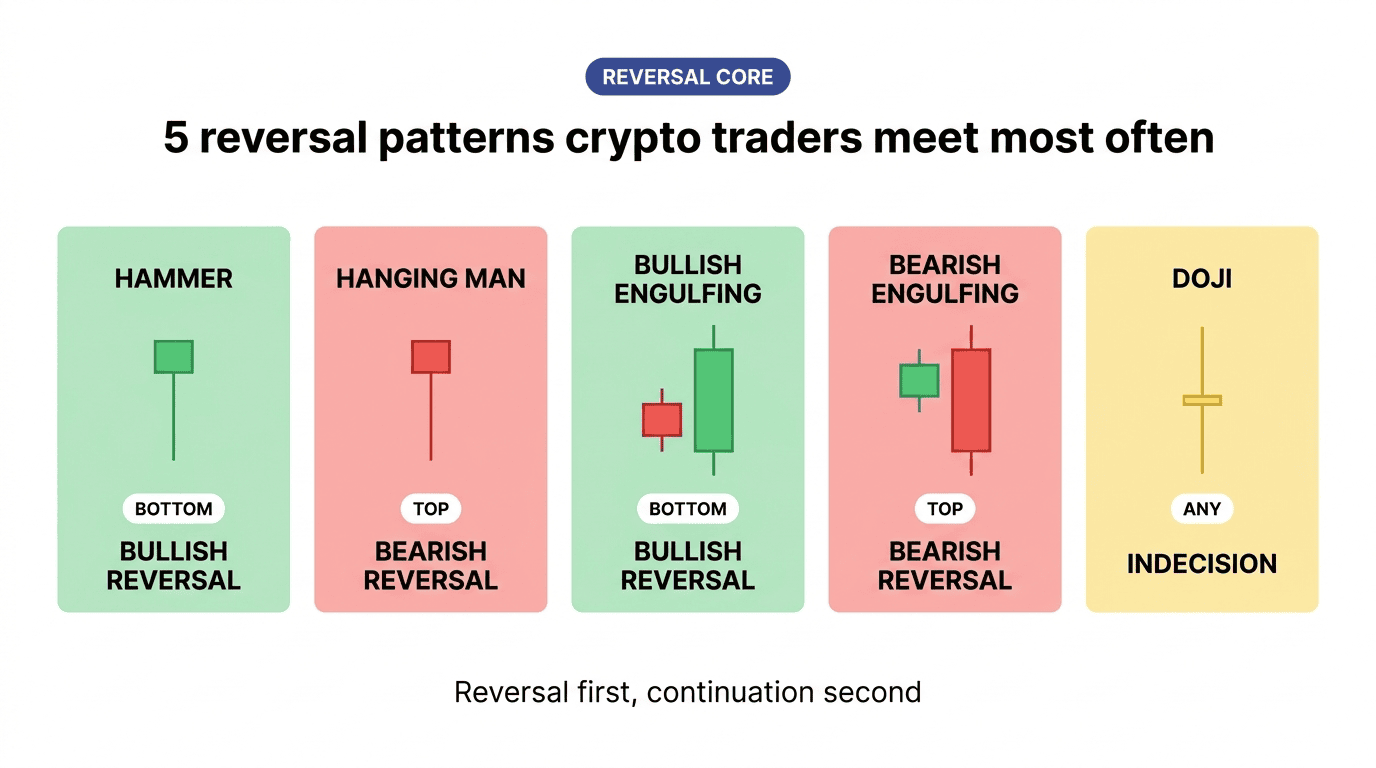
A candle with a tiny body where open and close are nearly equal. Wicks can be short, long, or asymmetric. The doji signals indecision in the market.
Psychology: Buyers and sellers fought to a stalemate during the period. After a strong trend, this stalemate often precedes a reversal. The doji on its own is just a warning, not a trade signal.
How to trade: Use the doji as a flag, not an entry. Wait for the next candle to confirm direction. A doji at major support followed by a strong bullish close is a high-probability long. A doji at major resistance followed by a strong bearish close is a short setup.
6. Morning Star
A three-candle bullish reversal pattern: a long bearish candle, then a small-bodied candle (often a doji) that gaps down, then a long bullish candle that closes well into the first candle's body. The morning star candlestick pattern marks the bottom of many downtrends.
Psychology: The first candle continues the downtrend. The second shows sellers losing momentum. The third shows buyers taking over decisively. The narrative arc plays out across three sessions, which is why the signal is more reliable than any single candle.
How to trade: Enter long at the open after the third candle closes. Stop-loss below the second candle's low. Target prior resistance.
7. Evening Star
The bearish counterpart to the morning star. A long bullish candle, then a small-bodied candle that gaps up, then a long bearish candle closing well into the first body. The evening star candlestick pattern marks the top of many uptrends.
Psychology: Buyer momentum stalls in the middle candle, then sellers take over with conviction in the third. Three candles, three psychological phases.
How to trade: Short at open after the third candle, stop above the second candle's high.
8. Shooting Star
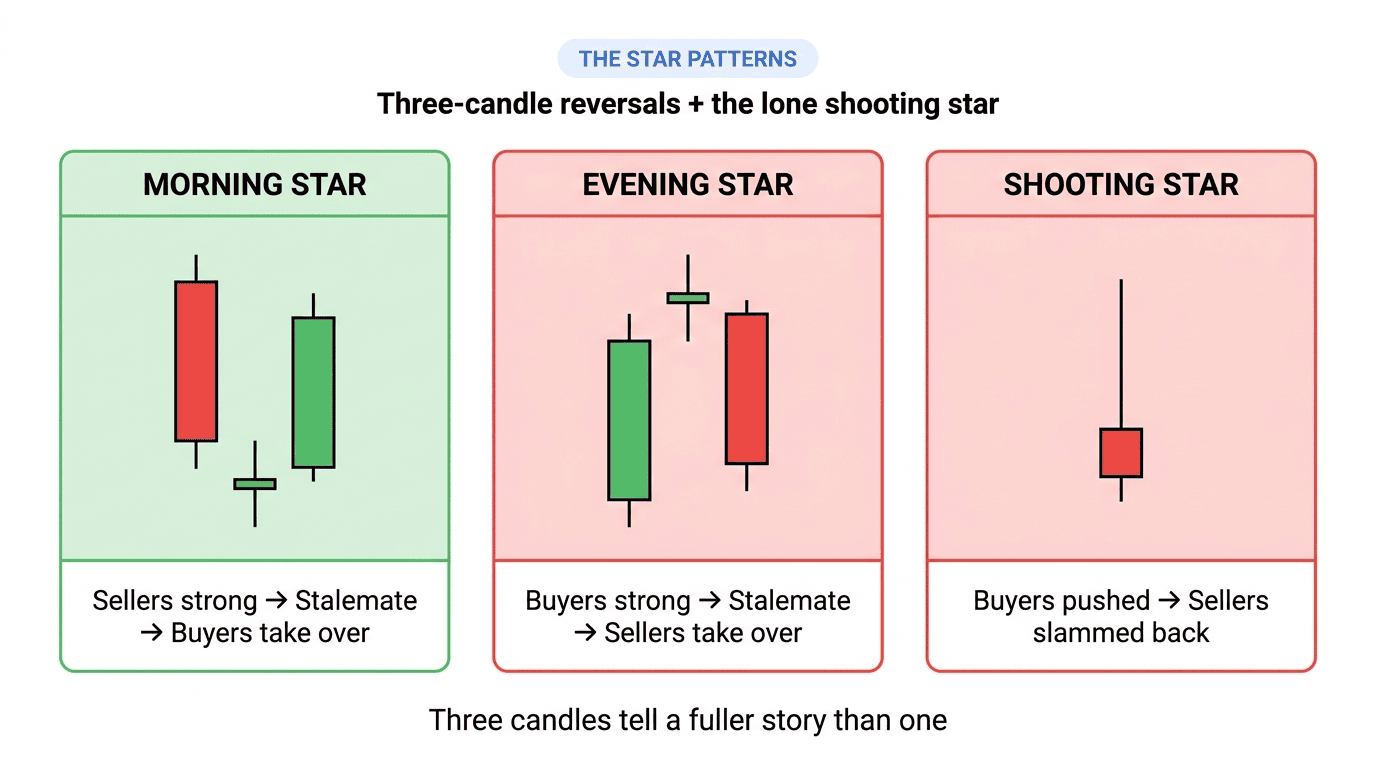
A small body at the bottom of the range, a long upper wick at least 2x the body, and little or no lower wick. Appears at the top of an uptrend.
Psychology: Buyers pushed price up hard, sellers slammed it back down before close. The long upper wick is the rejection signature. Often appears at major resistance or after a parabolic move.
How to trade: Confirmation candle (close below the shooting star's body) before shorting. Stop above the shooting star's high. The shooting star candlestick pattern is one of the cleanest exhaustion signals available.
9. Three White Soldiers
Three consecutive long bullish candles, each closing near its high, with each candle opening within the body of the prior candle. The three white soldiers candlestick pattern is the strongest bullish continuation signal in the candlestick library.
Psychology: Buyers controlled three consecutive periods without giving sellers an opening. This is decisive accumulation, especially after a base or consolidation.
How to trade: Enter on a pullback to the highest white soldier's open, or buy breakouts above the third candle's high. Be cautious in already-extended trends; the three white soldiers can mark a climax rather than a continuation.
10. Three Black Crows
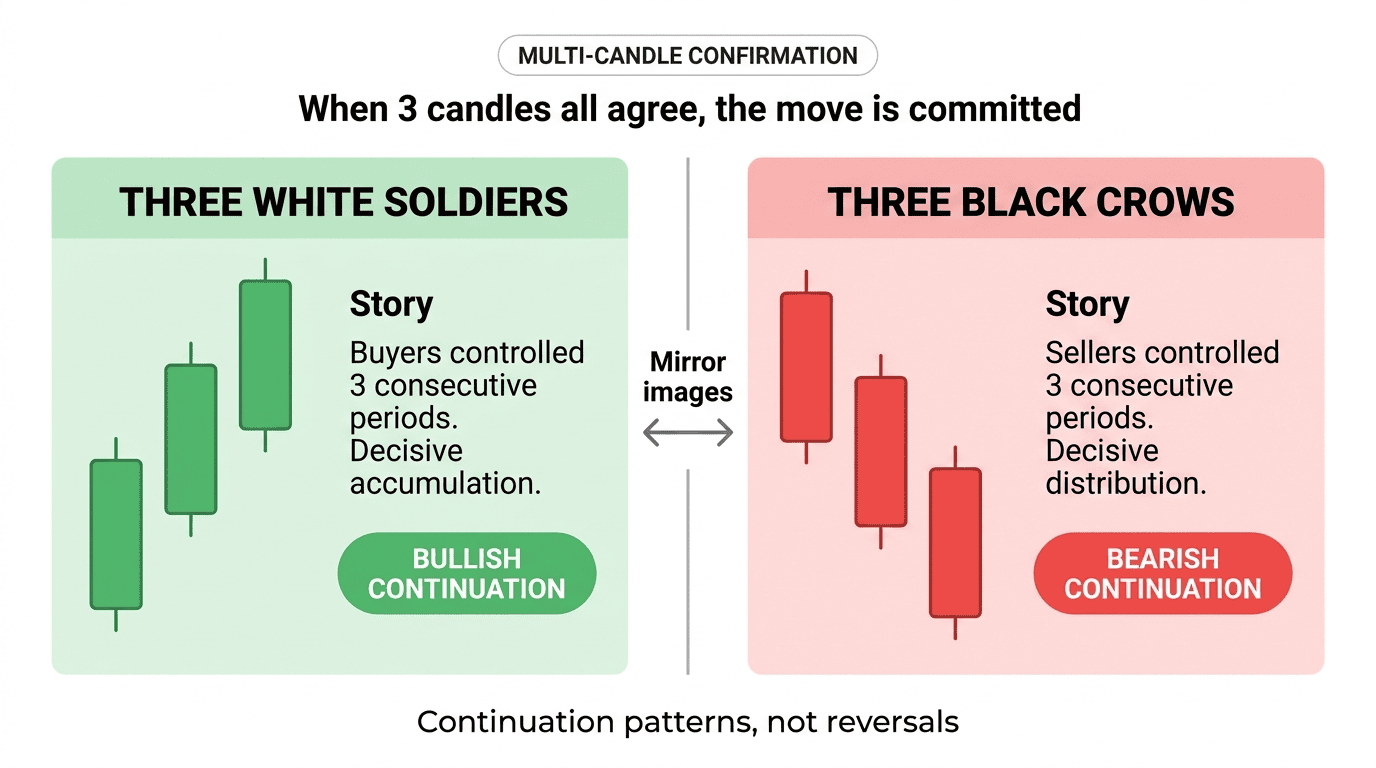
Three consecutive long bearish candles, each closing near its low, each opening within the prior candle's body. The three black crows candlestick pattern is the bearish counterpart to three white soldiers, and equally powerful.
Psychology: Sellers controlled three consecutive periods. The pattern often appears at market tops or during the early phase of a sustained decline.
How to trade: Short on a bounce back to the highest crow's open, stop above. Three black crows after an extended uptrend often signal the start of a multi-week bearish leg.
Common Mistakes Even Pros Make with These 10 Patterns
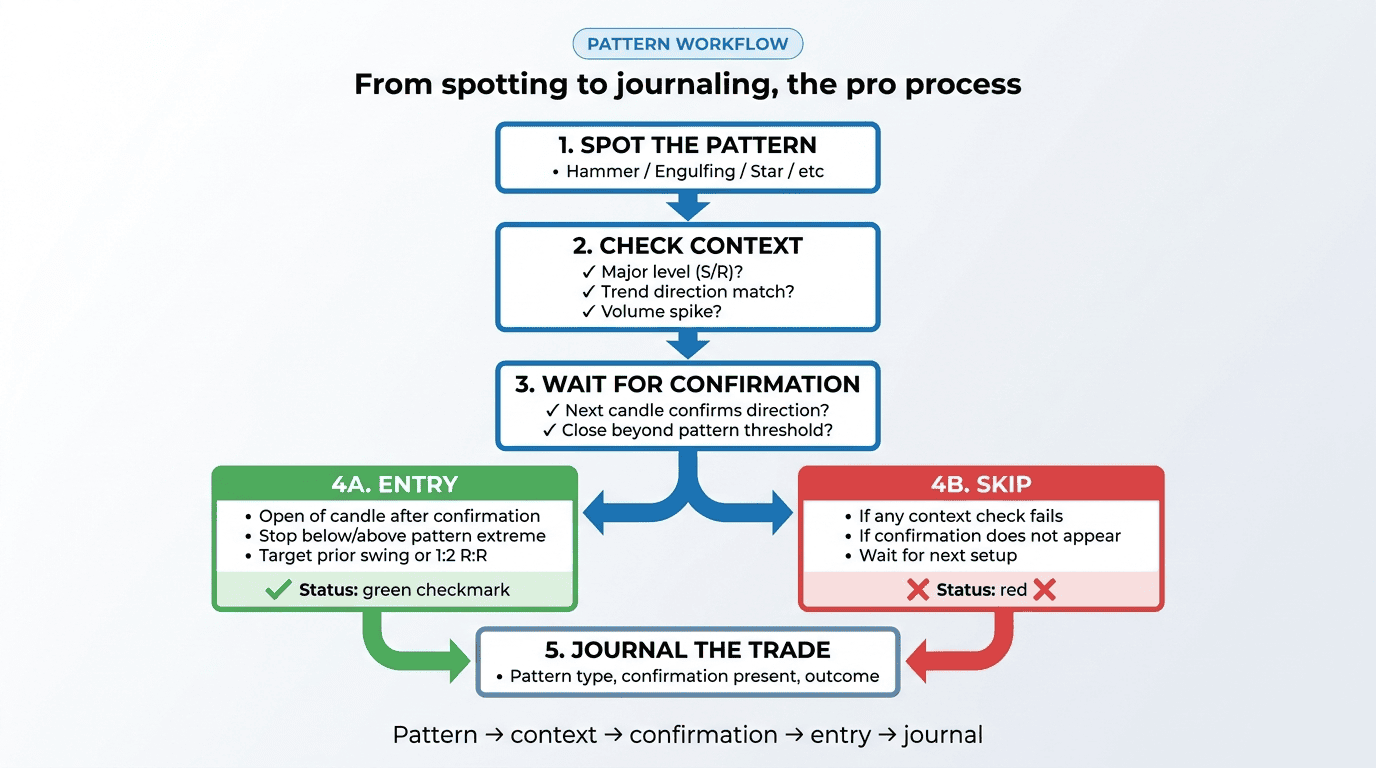
1. Trading patterns in isolation. A bullish engulfing in random no-man's-land is much weaker than the same pattern at major support. Always anchor patterns to context.
2. Skipping confirmation. Reversal patterns are setups, not entries. The candle after the pattern has to confirm the direction before you commit. Pros wait. Amateurs front-run.
3. Ignoring volume. A bullish engulfing on low volume is suspect. The same pattern on a volume spike is high-conviction. Always check the volume bar.
4. Forcing patterns where none exist. After learning a pattern, you start seeing it everywhere. Most candle formations are random. Be ruthless: if the pattern requires squinting or forgiving on rules, it is not the pattern.
5. Trading the lowest timeframe. A hammer on the 1-minute chart is barely meaningful. The same hammer on the daily chart aggregates 24 hours of psychology. Higher timeframes filter noise.
6. Position sizing on conviction instead of risk. Even a textbook three white soldiers pattern fails sometimes. Size every trade so a single loss is small. Reserve large position sizes for situations where pattern, level, volume, and trend all line up, not just one of them.
How to Practice These 10 Patterns in Altrady
Pattern recognition compounds with reps. Inside Altrady, the workflow looks like this:
- Multi-exchange chart view. Watch BTC/USDT, ETH/USDT, and a few alts side by side on the daily chart. Patterns that show up across multiple coins are stronger signals than isolated occurrences.
- Smart Watchlist with technical alerts. Tag your favorite pairs and set alerts on key candle events: "close above 50-EMA," "long lower wick at support." Patterns will catch your attention without staring at the screen.
- Paper trading. Test each of the 10 patterns on paper before committing real capital. Track win rate and average R-multiple per pattern type. After 30 trades you will know which patterns work for you and which don't.
- Trade journal. Every trade should record which pattern triggered the entry, whether confirmation was present, and the outcome. After 50 trades, your journal will show patterns of bias (e.g., "I take hammer entries without confirmation 60 percent of the time and lose more on those") that you cannot see in the moment.
Frequently Asked Questions
How many candlestick patterns do I really need to know?
For most crypto traders, 10 patterns is the sweet spot. Master hammer, hanging man, bullish engulfing, bearish engulfing, doji, morning star, evening star, shooting star, three white soldiers, and three black crows. Add patterns beyond these only if you find a recurring setup in your specific market that the core 10 do not cover.
What is the most reliable candlestick pattern?
Statistical studies put bullish and bearish engulfing among the top reliability rankings at 60-65 percent win rate when traded with confirmation and at meaningful levels. Three white soldiers and three black crows also rank high but appear less frequently.
Do candlestick patterns work on lower timeframes?
Yes, but reliability drops significantly below 1-hour. Patterns on 1-minute and 5-minute charts often reflect random noise, not meaningful psychology. Stick to 4-hour and daily for swing trading; 1-hour and 15-minute for day trading.
Can I automate trades based on these 10 patterns?
Yes, with caveats. Pure pattern detection produces too much noise. Effective automated strategies layer pattern recognition with trend filter (e.g., trade bullish patterns only above 50-day MA), volume confirmation, and key-level proximity. Altrady supports this kind of multi-condition automation through its Smart Trading and bot features.
What pattern is best for crypto specifically?
Hammer and bullish engulfing tend to perform especially well in crypto because of the market's tendency for sharp drawdowns followed by V-shape recoveries. Both patterns capture the moment when buyers absorb capitulation selling, which is a common dynamic in BTC and ETH cycles.
Final Thoughts
The 10 patterns above are not the only candlestick patterns that work. They are the ones that work most often, on the most charts, with the clearest psychological story. If you can recognize them on sight, anchor them to context (trend, level, volume), and require confirmation before entering, your candle reading will already be ahead of most traders who chase exotic patterns from textbooks.
The remaining work is reps. Open Altrady, scan a few pairs, watch for these 10 patterns at meaningful levels, and journal the outcomes. After a month of focused practice, you will look at any chart and immediately see which of these 10 stories the market is telling you.
Ready to put it into practice? Start your Altrady free trial and use the multi-exchange charts, technical alerts, and paper trading account to drill these 10 patterns until they become reflex.