 Binance
 Bybit
 Coinbase
 Kraken
 KuCoin
 OKX
 MEXC
 Hyperliquid
Every plan
Basic
€28 a month- Altrady Charts, with trading on the chart
- Unlimited charts per tab and indicators per chart
- 12 chart types and bar replay
- 50 price alerts
- Paper trading
Altrady 6.0Chart it. Script it. Trade it.
Altrady Charts gives you the charts, scripts, backtests and alerts you open TradingView for. Then it does what comes next: the order, the bot and the journal, on your own exchange accounts.
Side by side
TradingView is a great place to chart and share ideas. Altrady Charts covers the charting and scripting you open it for, then places the trade on your exchange.
| Feature | Altrady | TradingView |
|---|---|---|
| Charting | ||
| Drawing tools | Lines, Fibonacci and Gann, patterns, shapes and notes | 110+ drawing tools |
| Indicators and community scripts | 112 built-in open scripts, plus a marketplace where traders publish their own indicators and strategies, free or paid | 400+ built-in, plus 150K+ community indicators |
| Volume footprint | On Premium, with a preview on Binance Futures BTC/USDT | On higher plans |
| Scripting and testing | ||
| Script language | Coinray Script, TypeScript-based, for indicators and strategies | Pine Script |
| Your Pine Script | Paste v5 or v6 and convert it | Runs natively |
| AI writes the script | Built-in assistant, or your own over MCP | Not stated on its pricing page |
| Strategy backtesting | One market or many in one run, with a Holds, Mixed or Doesn't hold verdict, slippage and leverage settings, and saved runs you compare and restore | Strategy tester on one symbol at a time |
| Chart replay | Replay from any date and place trades with a stop and target as it plays, with risk/reward before you confirm, automatic breakeven and a P&L review of the session | Bar replay, with trading in replay on higher plans |
| Markets and research | ||
| What you can chart | Crypto spot and futures, TradFi, forex, indices, dominance and market cap | 3.5M+ instruments: stocks, forex, futures, crypto and more |
| Formulas between markets | Combine markets with + − × ÷, such as ETH/USDT ÷ BTC/USDT | Spread charts |
| Scanners | Scanner on your own indicator rules, Base Scanner for QFL bases, and a Screener | Stock, ETF and crypto screeners, and a Pine Screener |
| Watchlist import | Import your TradingView lists, sections kept as groups | Import and export |
| News and economic calendar | Both, beside the chart | Both |
| Trading | ||
| Trade from the chart | On 19+ crypto exchanges you connect by API key | Through selected brokers, with OKX and Kraken listed for crypto |
| Smart orders | Entry, several take profits and a stop in one order, with trailing take profit and stop, stop cool-down and Emergency SL | No multi-target smart orders, trailing take profit or Emergency SL |
| Entries and order types | TWAP, ladder and OCO orders, entries at a trendline, and Smart Sell for coins bought elsewhere | No TWAP, ladder or trendline entries; standard order types through brokers |
| Risk rules | Risk profiles that warn or block: risk per trade, max leverage, daily loss cap, cooldown after a loss, no widening the stop (Premium) | No |
| Paper trading | Orders and bots on a paper account | Simulated trading |
| Automation and AI | ||
| Trading bots | Grid, DCA, HODL, Signal, TradingView and Webhook, with backtests for DCA and grid bots | No built-in bots; alerts can send webhooks to other tools |
| AI assistant on your account | Connect Claude, ChatGPT or Cursor over MCP; every change waits for your confirmation | No |
| Alerts | ||
| Alerts | Price, trend line, time, indicator and delisting alerts, to push, email, Discord, Telegram or a webhook | Price, technical and watchlist alerts, with webhooks on paid plans |
| Review and portfolio | ||
| Trading journal | Rate, tag and review trades, with AI reviews, stats and breakdown reports | No |
| Portfolio | Every exchange account and external wallets in one overview, in folders | Portfolios you keep by hand, or broker accounts via Plaid |
| Price | ||
| Price per month | €28 to €90, charts and trading included | €14.95 to €69.95 for Essential to Premium |
Altrady details are from help.altrady.com. TradingView details are from tradingview.com/pricing and tradingview.com/brokers, checked 13 November 2026. Not stated means we could not find it on those pages, not that it does not exist. Prices are monthly billing. Altrady is not affiliated with TradingView.
Switch
Years of scripts, drawings and lists should not be the reason you stay. Altrady reads all three.
Pine Script · v5 and v6
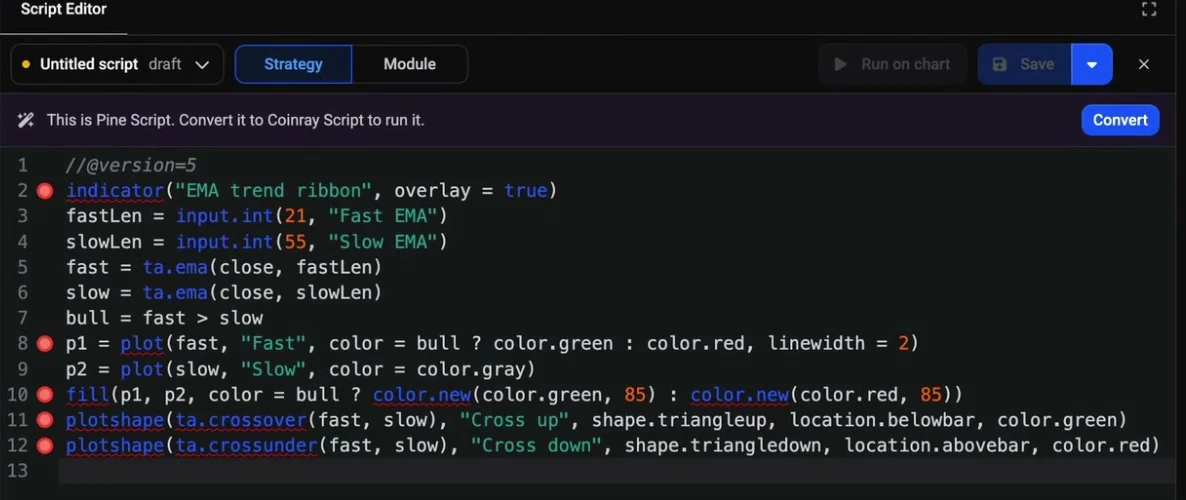
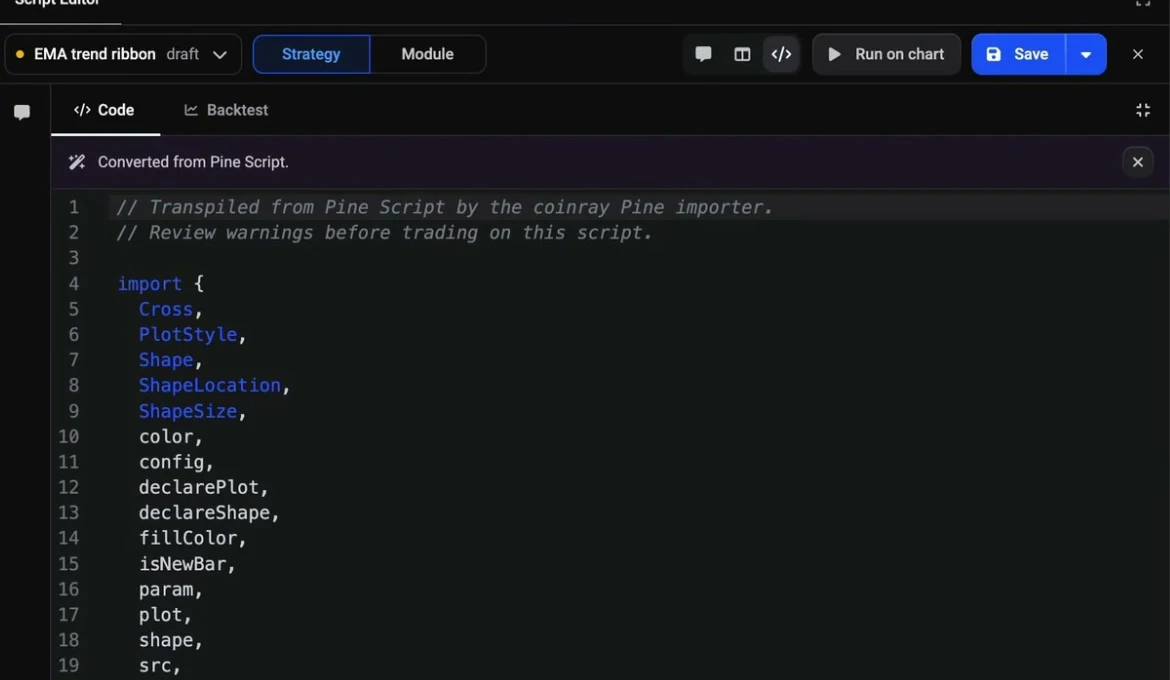
Altrady recognises Pine when you paste it, and converts indicators and strategies into Coinray Script you can run, edit and backtest.
Both kinds convert, from Pine Script v5 and v6.
Warnings are marked on the lines they affect, so you know what to check before you rely on it.
Run it on a chart, save it, and change it like any other script.
1Paste it. Altrady says: This is Pine Script.
2Click Convert. It becomes Coinray Script.
Layouts and drawings
If you have saved charts on the TradingView chart inside Altrady, they move to Altrady Charts as layouts.
Your drawings and saved indicator templates move over.
The ones Altrady Charts also has come along, with their default settings.
It lists what moved and what to add again, so nothing goes missing quietly.
TradingView export
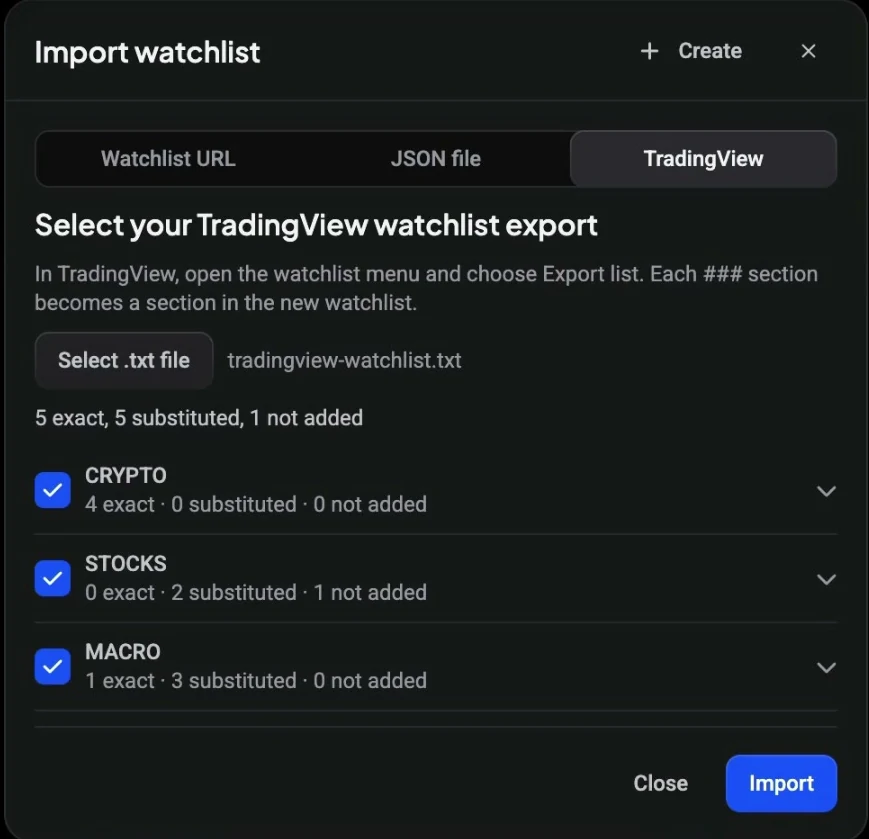
Export a watchlist from TradingView and import the file. Each section in the file becomes a section in Altrady.
Each symbol is mapped to a market, with a count of exact, substituted and not added.
Open any section to see every symbol, and untick what you do not want.
Stock and macro symbols are matched too, where Altrady has an equivalent market.
Your converted script draws on the market you have open.
One backtest run, with a verdict on whether it holds.
On the script, one of its plots, or a strategy order.
An alert can hand the signal to a bot that places the order.
Conversion coverage depends on the script: not every Pine feature has an equivalent, and the converter tells you what it left out. Chart migration applies to charts saved on the TradingView chart inside Altrady.
Chart
Altrady Charts is the default chart in Altrady. Everything you reach for is there, and so are your orders and positions.
Draw and read
The tools you use a hundred times a day should take no thought.
Open the Flywheel at your cursor instead of hunting through menus.
Scrolling and zooming stay responsive as candles, drawings and indicators pile up.
Colours, candle style, scales and themes, with a live preview while you change them.
Each one an open script you can read and copy.
Candles, Heikin Ashi, line, bar, area and more.
Each with its own market and timeframe.
Rebuild any stretch of the market candle by candle.
Lines
Trend lines, rays, horizontal and vertical lines, trend angles and parallel channels, for trends, support and resistance.
Fibonacci and Gann
Fib retracement, trend-based Fib extension, Fib channel, fans and Gann tools. Click a swing low, then a swing high.
Patterns and measuring
Chart pattern and Elliott wave tools, plus price and date ranges to measure a move.
Shapes
Brushes, arrows, rectangles, circles, ellipses, triangles, polylines and paths.
Annotations
Text, notes, callouts and price labels, plus emoji and icons on the chart.
Your drawings
Lock a level so a stray click cannot move it, style each drawing, and save a style as a template. Drawings stay with the market you drew them on.
Indicator templates
Save every indicator on the chart with its settings, then open it on any market.
Chart layouts
Save a layout and bring it back on another chart. Templates and layouts are stored on your account, on every device.
Indicators
Move an indicator to another pane, and give it its own scale or share one.
Timeframes
Star your favourites, or add a custom interval such as 45 minutes.
Sub-minute candles have no history: they build from the moment you pick the timeframe, and replay does not run on second timeframes.
Footprint
A footprint chart splits each candle into price rows and shows how much was bought and sold at each one.
Sell volume on the left, buy volume on the right, with the busiest row outlined.
Binance, Binance Futures, Bybit Futures and Hyperliquid Futures.
Bid × Ask, Delta, Volume profile, and Delta + volume, with lopsided rows highlighted.
Grids
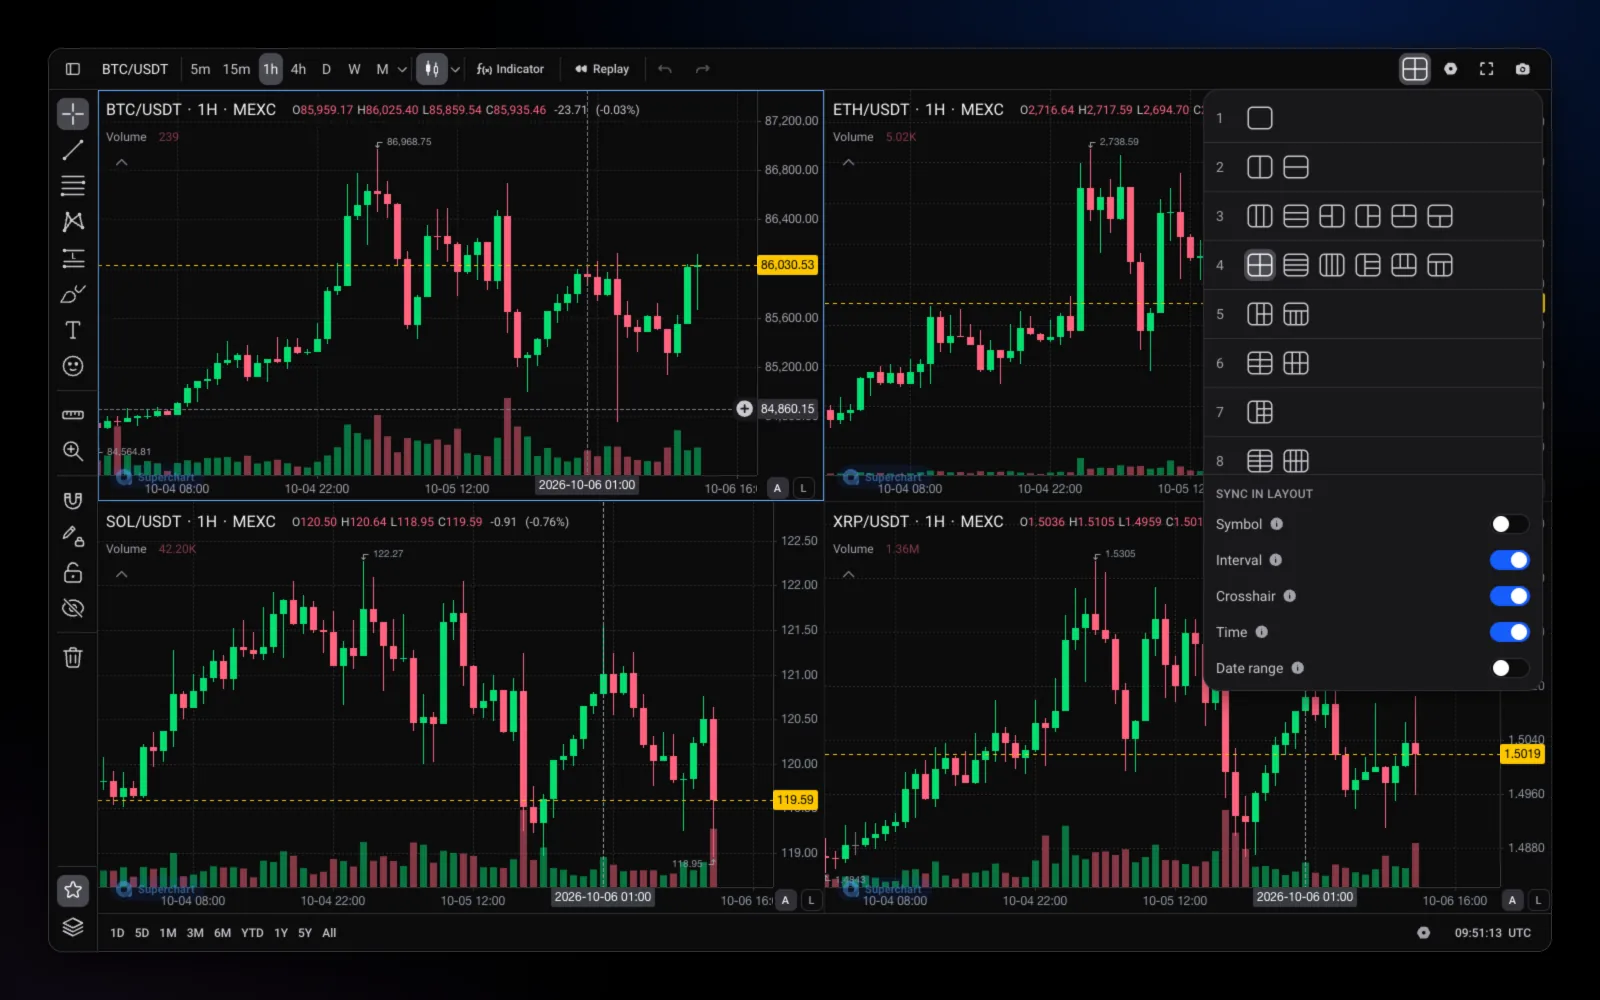
Watch a coin across timeframes, or a sector side by side.
Symbol, interval, crosshair, time and date range, each with its own switch.
And bring the same grid back on another tab.
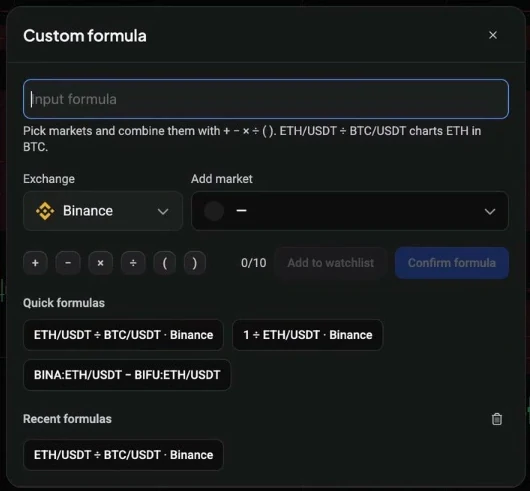
Custom formula
ETH/USDT ÷ BTC/USDT charts ETH priced in BTC.
With plus, minus, multiply, divide and brackets.
A coin in another coin, the inverse of a market, spot against perpetual, and the ones you used last.
Orders
Or cancel it from the chart with one click.
Positions
A handle shows result and size where you got in. Close the position from its line.
Alerts
Price, time and trend line alerts drawn on the price.
Order labels
Pick PnL, amounts or values, or choose the parts per line.
The volume footprint is on the Premium plan, with a preview on Binance Futures BTC/USDT for everyone. The TradingView chart is still available inside Altrady as a chart provider; new chart features are built for Altrady Charts.
Script
The Script Editor sits next to your chart, on the web and in the desktop app. A first script takes a few minutes.
AI assistant
Describe a strategy in plain words, such as an EMA 20/50 crossover with a 2x ATR stop loss.
Thinks, writes the code, compiles it, runs a short backtest and puts it on your chart.
Such as only taking longs above the 200 EMA. Undo any change you do not like.
Connect Claude or another assistant over MCP and it can write and backtest scripts here, without using AI credits.
Script editor
Scripts are written in Coinray Script, which reads like TypeScript. Type beside the chart and run it.
The console names the line each one belongs to.
Compile and draw on the market you have open, in one click.
Keep the script on your charts in other layouts too.
Built-in and public
Every built-in indicator is an open script. Copy one to your own scripts and change it.
Read how each one works, line by line.
Use what other traders published.
Indicators you bought in the marketplace sit in the same menu.
Coming from Pine
If you can read Pine Script, you can read this.
Inputs, plots, shapes and the ta functions you already use have counterparts.
Values carry a type, so mistakes show up when you compile, not on a live chart.
Paste Pine Script v5 or v6 and the converter writes this for you.
Versions
Open the history and go back to an earlier one.
Modules
A script that only holds functions becomes a module you import elsewhere.
Publish
Or keep it private. Rename, duplicate and delete from the same menu.
Alerts and backtests
Test a script on past candles, then be told when it signals.
The AI assistant uses AI credits, which refill monthly with your plan. Without credits you can still edit, run and backtest your own code. The Script Editor works on the web and desktop, not on the phone.
Test
A good result on one market can be luck. Run the same script across many and see whether it holds.
The headline
With a plain sentence on top that says what happened.
The risk
The largest fall from a previous high, shaded on the equity curve.
The benchmark
A line for holding the coin over the same period.
The detail
Each trade with its exit reason, returns by month, Sharpe and Sortino, and fees paid.
Multiple markets · step 1
Switch the backtest to multiple markets and let Altrady pick them for you.
Top volume or top market cap, on the exchange and quote currency you choose.
Markets in an uptrend, a downtrend or ranging.
Add or remove any market before you run.
Multiple markets · step 2
Holds, Mixed or Doesn't hold. Holds means most markets were profitable and the median return was positive.
How many markets were profitable, and the median return.
Return, win rate, max drawdown and trades.
Click a row for its full report, then go back to the list.
Settings
Set the starting capital, the order size (a share of equity, a fixed amount or risk-based), commission, slippage, pyramiding, margin and leverage, then run again.
Saved runs
Save a run, edit the script, and read the new figures against the previous one. Restore the script version behind any run.
From the assistant
When the AI assistant writes a script, it runs a short backtest and links the full report.
Replay
The chart rebuilds itself candle by candle, exactly as it happened.
Stop at any candle and move forward one bar at a time.
Play slowly through the move, or run past a quiet stretch.
See only what you would have seen at that moment.
The future
Past results do not indicate future performance.
Every cost
Slippage and funding are not part of the result unless you set slippage yourself.
Without hindsight
Volume, market cap and trend describe markets as they are now, so a multi-market test has some hindsight in it.
From one run
Test another market or another period before you draw a conclusion.
Multi-market backtesting is on plans that include it, and how many markets you can pick depends on your plan. A script must compile before it can be tested.
Alerts
Hover a script in the chart legend, click the bell, and choose what to watch. It works on your own scripts, built-in indicators and ones you bought.
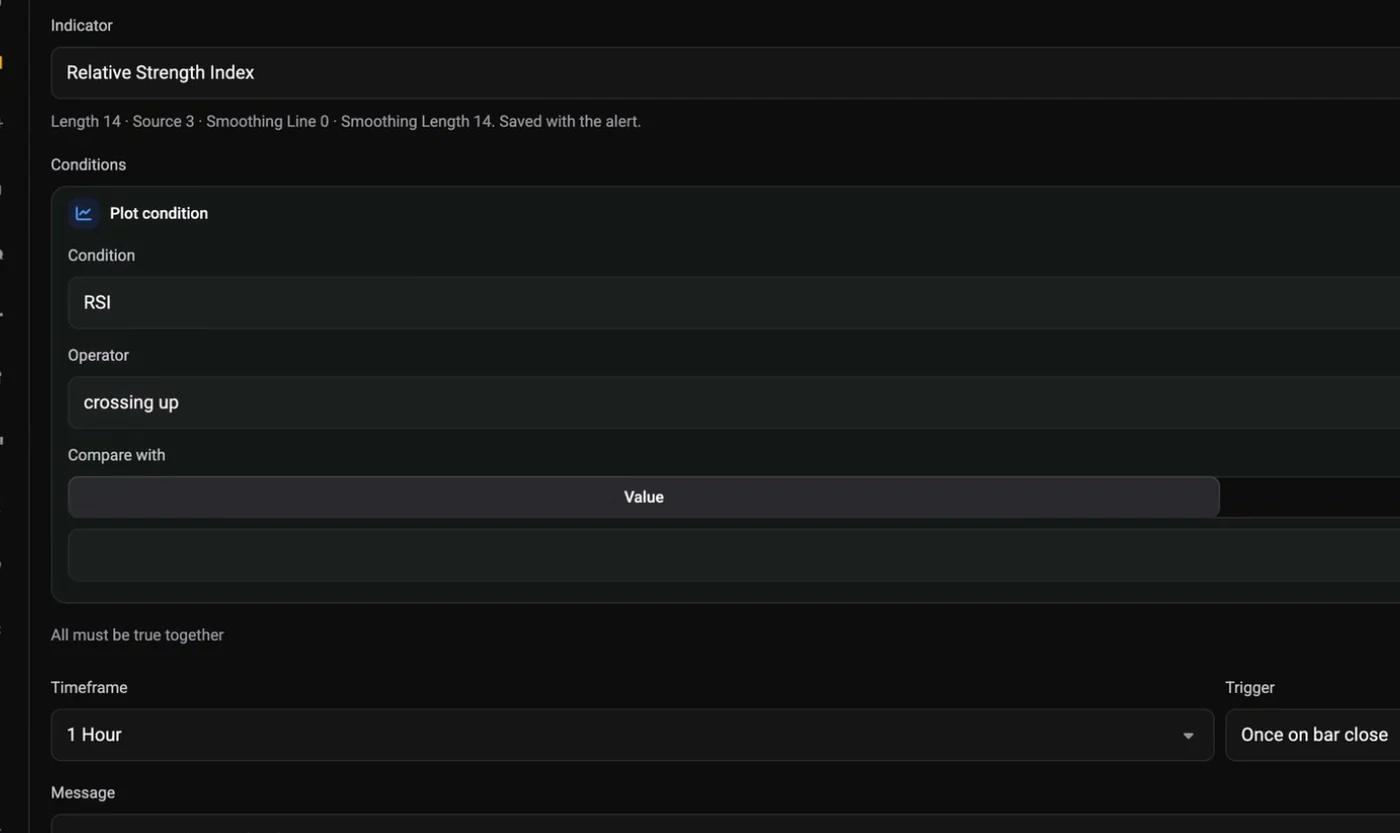
Plot condition
This is the real setup screen: RSI crossing up through a value on the 1-hour chart.
Any line the indicator draws, such as RSI.
Crossing up, in this example.
A value you type, or another plot.
The timeframe, and once on bar close or on every bar close.
Script alert
If your script raises an alert itself, the alert fires when it does, on a bar close. The message comes from the script.
Plot condition
A value or another plot. Add more conditions, and all must be true together before it fires.
Strategy orders
Be told each time a strategy fills an order on a live bar, on order fills, on alert() calls, or both.
Push and email
With the chart closed and the app in your pocket.
Sound
Pick one, or upload your own.
Discord and Telegram
Send alerts to a Discord or Telegram channel.
Your own words
Placeholders are filled in when the alert fires, including a plot's value.
On the chart, or on Altrady's side when the chart is closed.
To an Altrady Signal Bot, or to any external URL.
On your exchange account, with your take profit and stop loss.
Price, time and trend line alerts sit in the same widget. How many alerts you can keep depends on your plan, and an alert can be given an expiry.
Markets
Type a symbol and pick a tab. Stocks, currencies and the whole crypto market sit in the same search as your coins.
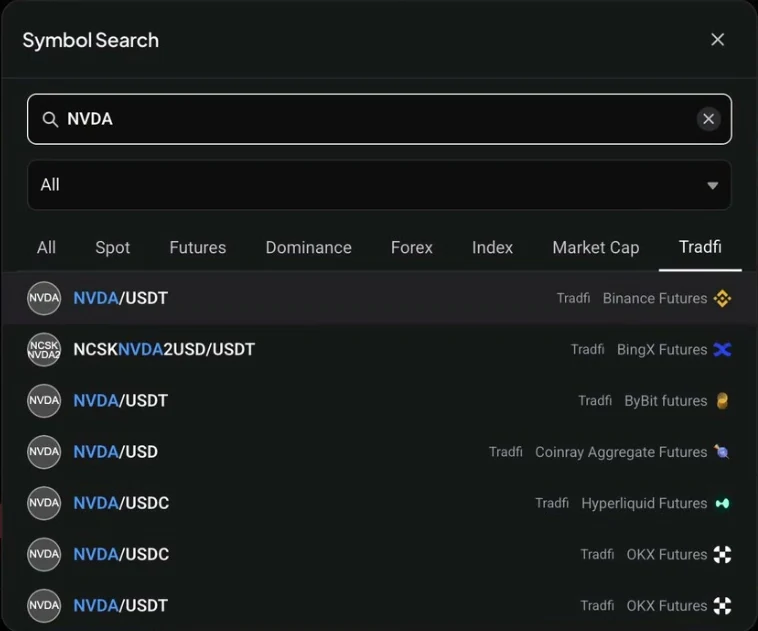
Symbol search · TradFi
Search NVDA or gold and chart the contract on the exchange that lists it.
The same asset on Binance, Bybit, OKX, Hyperliquid and more, each with its own chart.
These are futures contracts, traded on the exchange you connect.
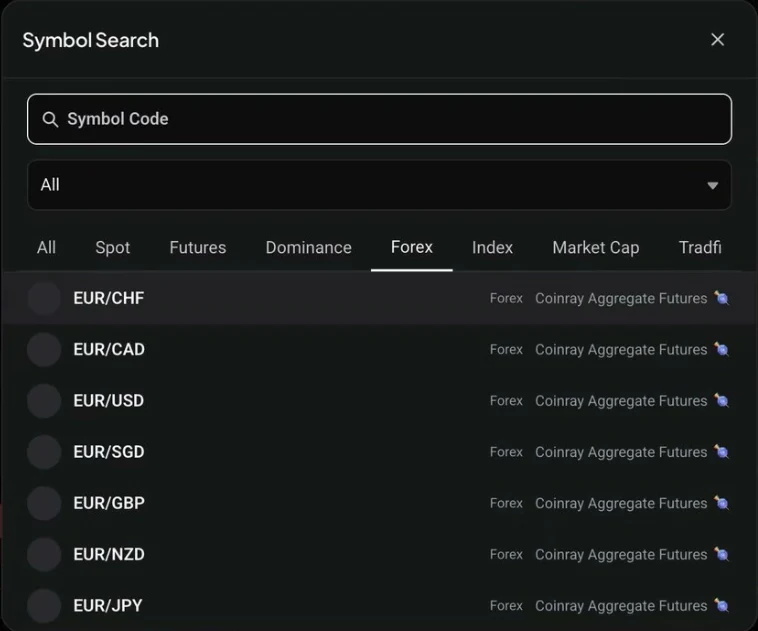
Symbol search · forex
EUR/USD, GBP/CHF, USD/CAD and more, with the same tools and indicators.
Put a currency pair beside a coin in one grid.
Price a market in another currency.
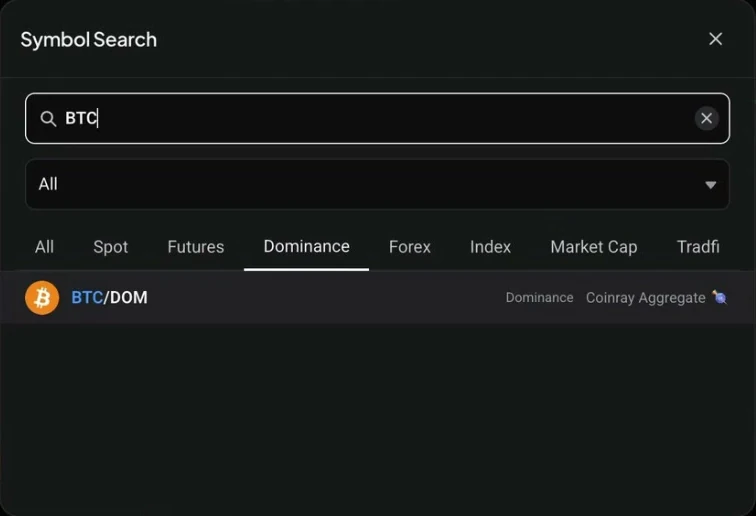
Symbol search · dominance
BTC/DOM and other dominance symbols open like any market, with timeframes, indicators and drawings.
See how dominance moved, not only where it is.
Levels and trend lines work the same way.
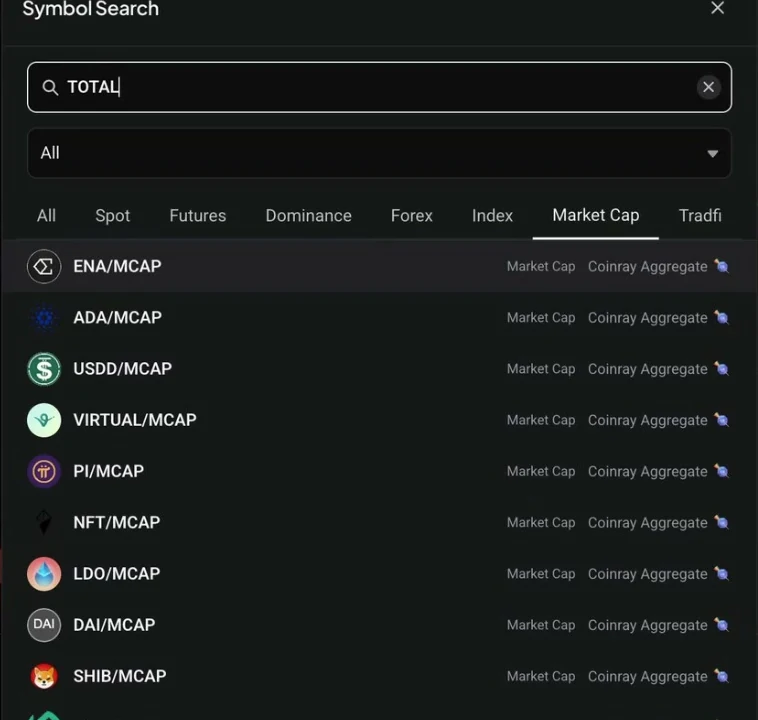
Symbol search · market cap
TOTAL, TOTAL3 and per-coin market cap symbols, charted like a price.
Chart total market cap, with or without the largest coins.
Chart a coin by its market cap instead of its price.
| Kind | Example | Source shown in search | What you can do |
|---|---|---|---|
| Spot and futures | BTC/USDT | Your exchange | Chart and trade |
| TradFi | NVDA/USDT · GOLD/USDC | Exchange futures, such as Binance, Bybit, OKX, Hyperliquid | Chart, and trade where listed |
| Forex | EUR/USD · GBP/CHF | Coinray Aggregate | Chart |
| Dominance | BTC/DOM | Coinray Aggregate | Chart |
| Market cap | TOTAL · ADA/MCAP | Coinray Aggregate | Chart |
| Formula | ETH/USDT ÷ BTC/USDT | Any markets you combine | Chart |
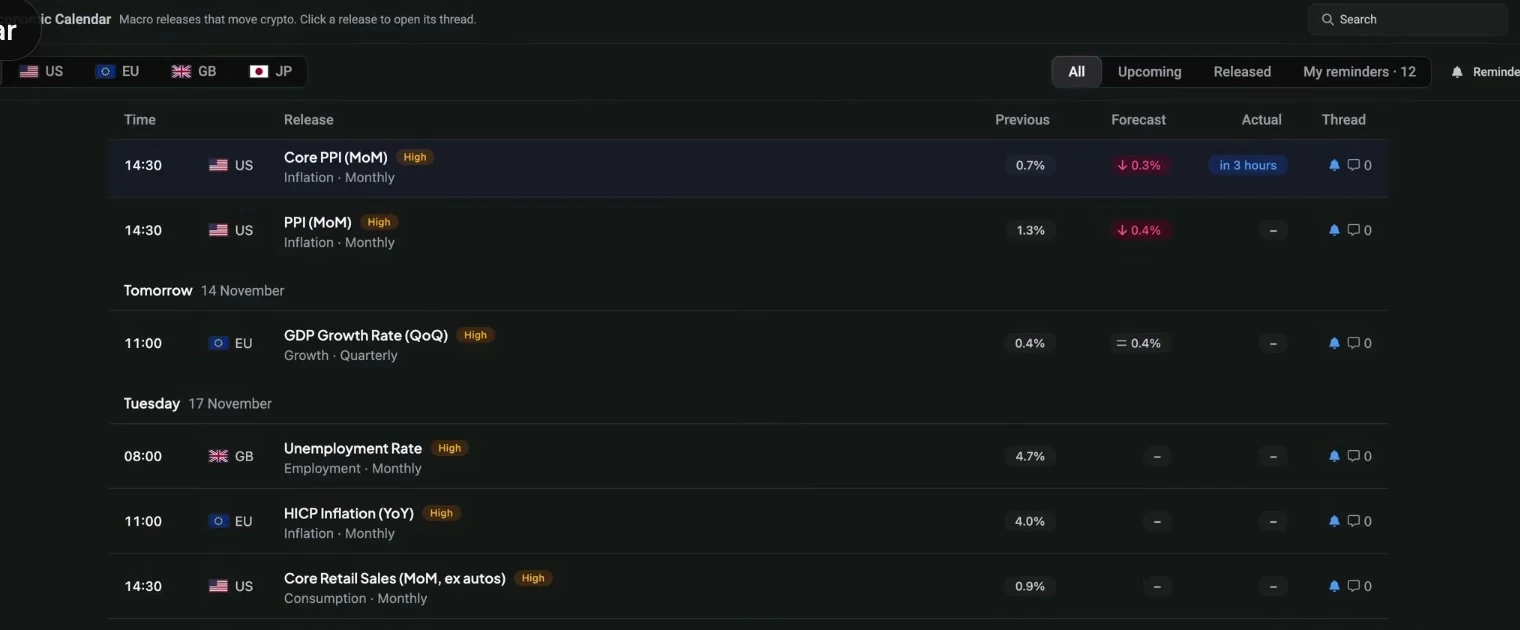
Economic calendar
Inflation, employment and growth figures, listed by day before they land.
United States, euro area, United Kingdom, Japan.
Each release with the three numbers that matter.
Be told before a release you care about.
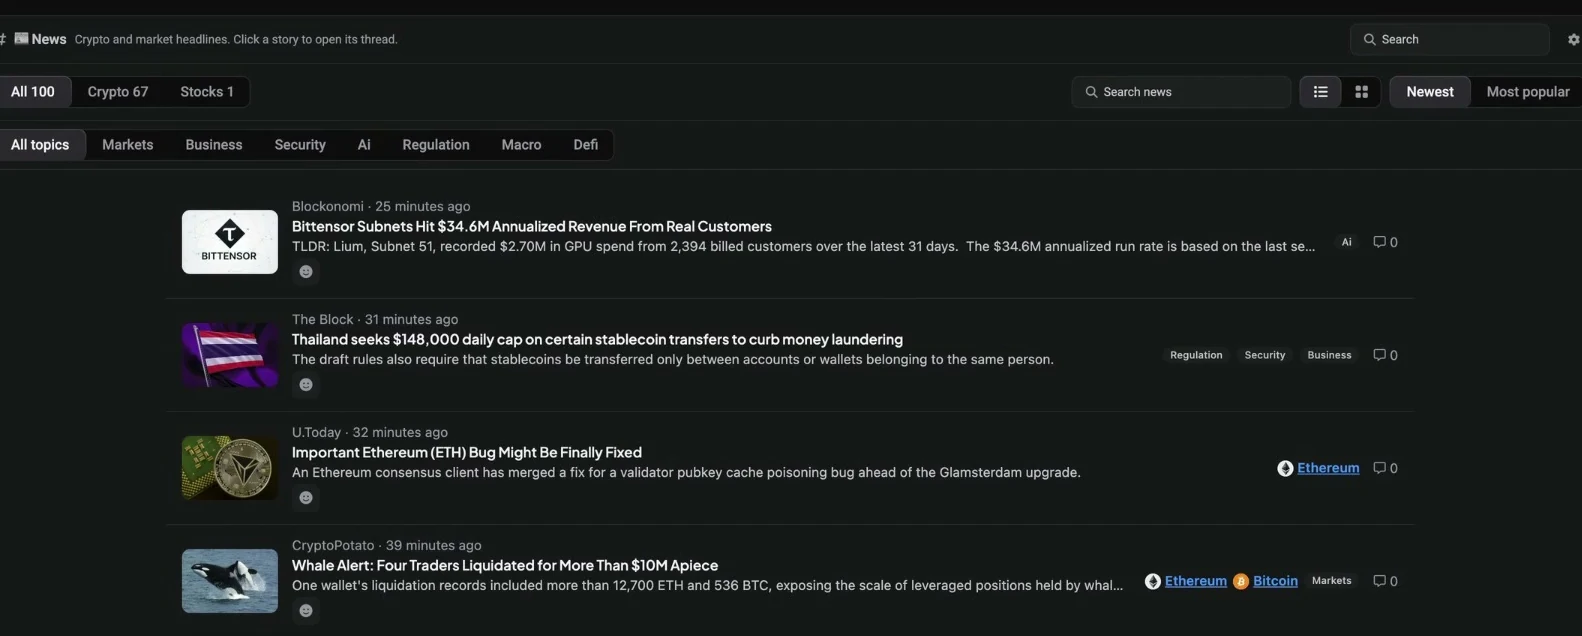
News
A feed of market news with the coins each story is about.
Markets, business, security, AI, regulation, macro and DeFi.
Filter to one, or read both together.
And search across headlines.
Market cap, 24-hour change, volume, high and low, and the trend across timeframes, above every chart.

Sources are as shown in symbol search. Aggregate charts are for analysis. Which markets you can trade depends on the exchanges you connect. News headlines link to their publishers.
Trade
The analysis is only half of it. In Altrady the order, the bot and the review live on the same screen as the chart.
A chart on its own
In Altrady
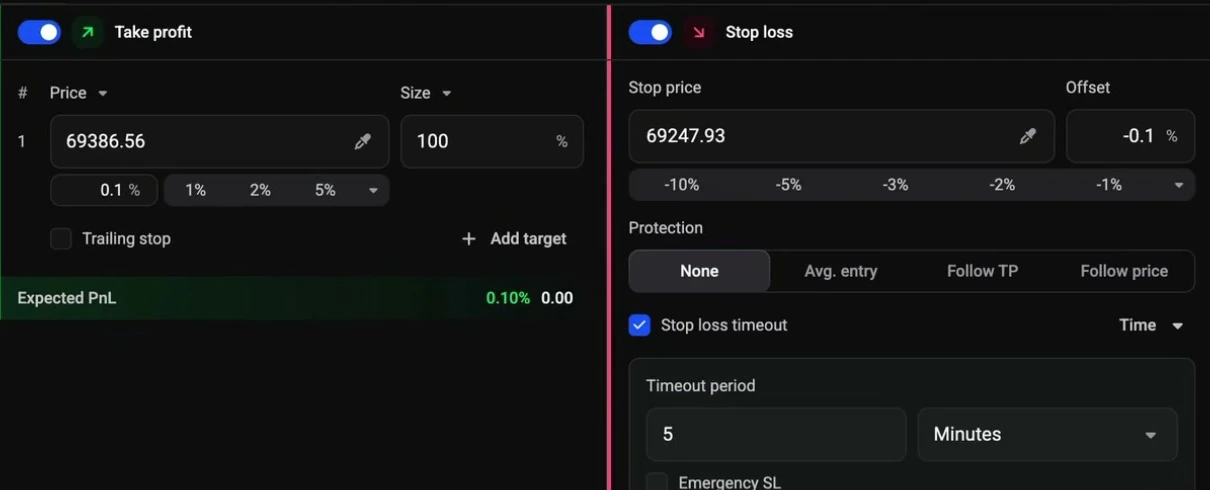
Smart order
One form for the exit plan, before you enter.
Several take profits, each with its own size, or a trailing stop.
Move the stop to your entry, follow a take profit or follow the price.
A stop loss timeout and an emergency stop for fast moves.
Grid bot
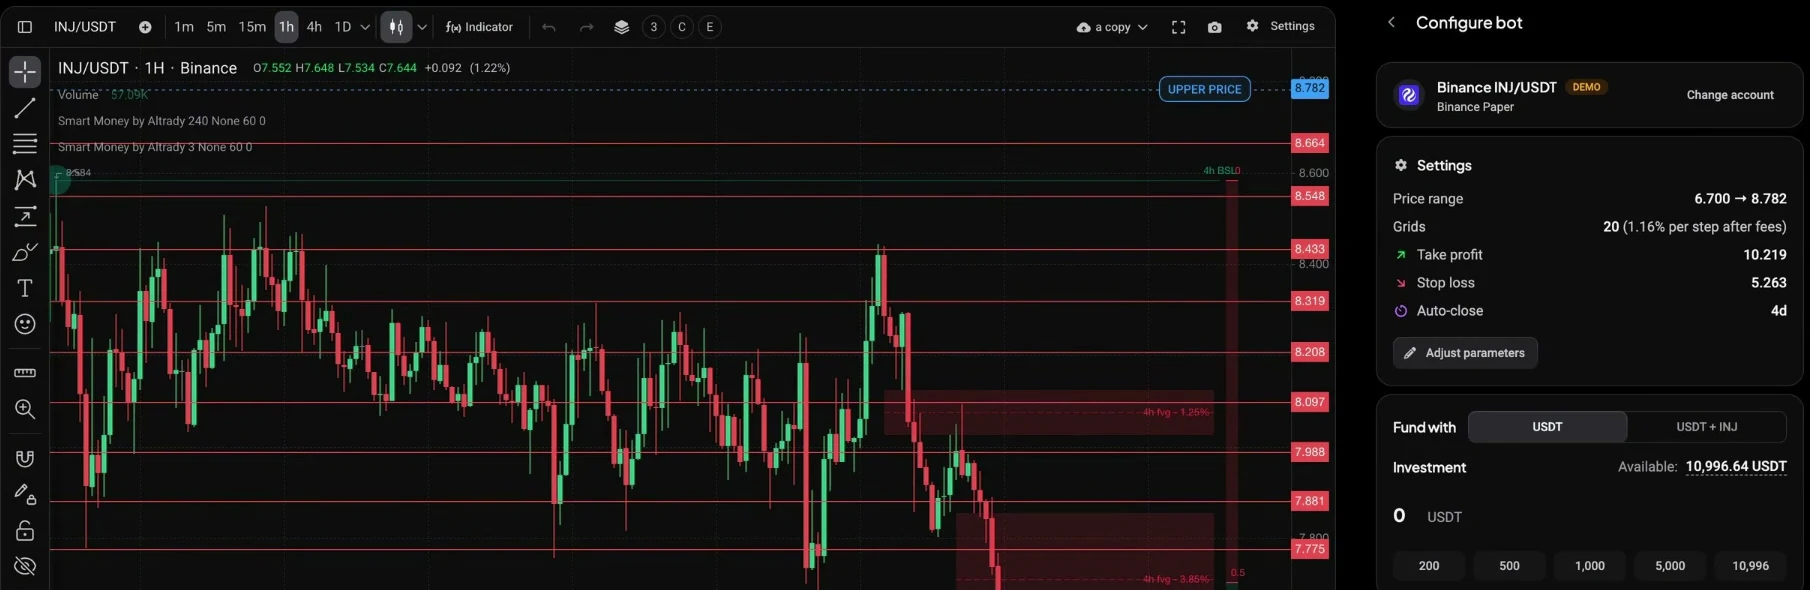
Configure a bot from the chart you are looking at, and see its levels on the price.
The price range and every grid level drawn where they sit.
Take profit, stop loss and auto-close set before it starts.
Run it on a paper account, then go live.
TradingView Bot
You do not have to choose on day one. Send your TradingView alerts to Altrady and a bot places the trade.
Entries, take profits and stop loss come from your alerts.
Still available inside Altrady. Switch the chart provider in settings.
Convert one script, import one list, and see how it feels.
Smart orders
Plan the whole trade on the chart, then drag the lines to adjust it.
Explore smart trading ›Bots
Grid, DCA, HODL, TradingView, Signal and Webhook.
Explore automation ›Scanners
Write a rule once and be alerted when any market matches.
Explore scanners ›Journal
Closed trades arrive in the journal with their real result after fees.
Explore asset management ›Altrady is trading software. It connects to your exchanges through API keys with read and trade permissions only, and never holds your funds.
Price
If Altrady Charts replaces it, this is what stops leaving your account. Charts are part of every Altrady plan.
TradingView · billed monthly, over a year
TradingView prices from tradingview.com/pricing, billed monthly × 12, November 2026. Billed yearly: €155, €359, €719. Altrady is not affiliated with TradingView.
Every plan
Adds
Adds
Black Friday · Nov 10 to Nov 30
On every yearly plan. Subscribe by November 30 and you also keep higher plan limits after December 1, including unlimited watchlists and chart layouts.
billed €204 yearly
Monthly plan €28 · normal yearly €20
€132 a year less than monthly
billed €360 yearly
Monthly plan €50 · normal yearly €35
€240 a year less than monthly
billed €648 yearly
Monthly plan €90 · normal yearly €63
€432 a year less than monthly
Offer valid Nov 10 to Nov 30, 2026 on yearly plans, billed once for the year. The Black Friday price applies to the first year, and the plan renews at the normal yearly price unless cancelled. The higher limits stay while your subscription is active.
Already on Altrady
Charts are in your plan. The TradingView subscription is what you stop paying.
New to both
At normal prices an Altrady plan costs more than a TradingView plan alone, and covers trading, bots and a journal too.
Paying for several tools
A charting plan, a bot platform and a journal, against one subscription.
Not sure yet
Free, with no credit card. Convert one script and decide.
Altrady prices are monthly billing; annual billing is lower. The two products do not cover the same ground, so this is not a like-for-like comparison.
See full Altrady pricing ›For crypto traders, yes. Altrady Charts covers charting, custom scripts, backtesting and alerts on indicators, and Altrady adds order execution, bots, scanners and a journal on 19+ exchanges. TradingView has a larger community of published scripts and ideas, so some traders keep both.
Yes. Paste a Pine Script v5 or v6 indicator or strategy into a new script. Altrady recognises it, shows "This is Pine Script", and converts it to Coinray Script when you click Convert.
No. Coverage depends on the script. When something could not be translated, the converted script says how many warnings there are and marks the lines, and the console explains what was left out. Check those before you rely on the result.
Charts you saved on the TradingView chart inside Altrady can be migrated to Altrady Charts layouts. Drawings and indicator templates move over, indicators Altrady Charts also has come along with their default settings, and a summary lists what moved. If you skip it at first, you can import them later from the chart settings.
Yes. Export the list from TradingView and import the file in Altrady. Each section in the file becomes a section in the new watchlist, and a summary shows which symbols matched exactly, were substituted or were not added.
Yes. A TradingView Bot trades the alerts from your own TradingView strategy on your exchange account, and the TradingView chart is still available inside Altrady as a chart provider. New chart features are built for Altrady Charts.
A first script takes a few minutes: paste it, convert it and run it on a chart. Importing a watchlist takes about a minute. Connecting an exchange is a few minutes more, and the first sync can take a little while.
Coinray Script, which uses TypeScript syntax. You write it in the Script Editor next to your chart. You can also describe a script to the AI assistant, start from a built-in indicator, or convert a Pine Script.
Yes. Describe the indicator or strategy in plain words and the assistant writes the code, compiles it, runs a short backtest and puts it on your chart. Each request uses AI credits. You can also connect your own assistant, such as Claude, over MCP, which does not use AI credits.
112, and each one is an open script. You can read how it works and copy it to your own scripts to change it.
Trend lines, rays, horizontal and vertical lines and channels; Fib retracement, extension and channel, fans and Gann tools; chart pattern and Elliott wave tools; price and date ranges; shapes; and text, notes, callouts and price labels. You can lock a drawing, style it, and save the style as a template.
Seconds (1 to 30), minutes, hours, days, weeks and months, plus any custom interval you add, such as 45 minutes. Each chart in a grid keeps its own timeframe. Sub-minute candles have no history, and replay does not run on them.
Yes. Switch the backtest to multiple markets and pick them by volume, market cap or trend. The summary says whether the result holds, is mixed or does not hold, with the share of profitable markets and the median return. It is available on plans that include it.
Net PnL, win rate, max drawdown and profit factor, an equity curve against simply holding, and every trade with its exit reason. Fees are included. Slippage and funding are not, unless you set slippage in the backtest settings. Past results do not indicate future performance.
Yes, on any indicator or strategy script on your chart, including built-in ones. The alert can watch the script's own alert, a condition on one of its plots, or a strategy's order fills, and it works when the chart is closed.
Up to eight on one tab, each with its own market and timeframe. You can link symbol, interval, crosshair, time and date range across them, and save a grid as a preset.
No. The Script Editor works in the web app and the desktop app. Charts, alerts and trading work on the phone.
Symbol search covers crypto spot and futures on 19+ exchanges, plus TradFi contracts such as NVDA or gold, forex pairs such as EUR/USD, indices, dominance charts such as BTC/DOM and market cap charts such as TOTAL. You can also chart a formula between markets.
What you can trade depends on the exchanges you connect. TradFi contracts are offered as futures on exchanges such as Binance, Bybit, OKX and Hyperliquid. Dominance, market cap and other aggregate charts are for analysis only.
Yes. It lists scheduled releases such as inflation, employment and GDP figures by country, with the previous, forecast and actual values, and you can set a reminder for a release.
Yes. Orders, positions and alerts are drawn on the chart. You can place an order at a price, drag an open order to move it, and close a position from its line.
A script's alert can send a webhook to an Altrady Signal Bot, which places the trade on your exchange account with the take profit and stop loss you set. You stay in control of the bot's settings and limits.
Yes. Paper trading is on every plan. You can place orders and run bots on a paper account, then switch to a live one.
Basic is €28, Essential €50 and Premium €90 a month, with lower prices on annual billing. Altrady Charts is part of every plan. Every plan starts with a free 5-day trial and no credit card.
Yes, from November 10 to November 30, 2026. Yearly plans are about 40% below the monthly price and about 15% below the normal yearly price: Basic €17, Essential €30 and Premium €54 a month, billed yearly. The discount is added at checkout, or use code BF2026. It applies to the first year, and the plan renews at the normal yearly price unless cancelled.
New plan limits start for trading, bots, charts and watchlists. If you have an active paid plan on that date, you keep the higher limits, including unlimited watchlists and chart layouts, for as long as your subscription stays active.
Yes. Every paid plan comes with a 30-day money-back guarantee.
At normal prices, no: an Altrady plan costs more than a TradingView plan, and also covers trading, bots, scanners and a journal. If you already use Altrady, replacing TradingView with Altrady Charts saves the full TradingView subscription.
No. Altrady is not affiliated with TradingView. TradingView and Pine Script are names of their respective owner, used here to describe compatibility.
No. Altrady connects to your exchanges through API keys with read and trade permissions only. It cannot withdraw, and your funds stay on your exchange.
●Converted from Pine ScriptEMA trend ribbon · running on your chart
Bring one script. Convert it, backtest it across markets, and place the trade from the same chart.
Start free trial
