
Time Series Forecast (TSF) Indicator for Crypto Trading is a useful content gap for Altrady because it covers a specific technical indicator that traders may see in advanced charting tools, but it is not yet explained as a dedicated Altrady article.
This guide keeps the focus practical. Instead of treating the Time Series Forecast as a magic signal, it explains what it measures, how crypto traders can read it, when it works best, and how to combine it with risk planning.
What the Time Series Forecast Measures
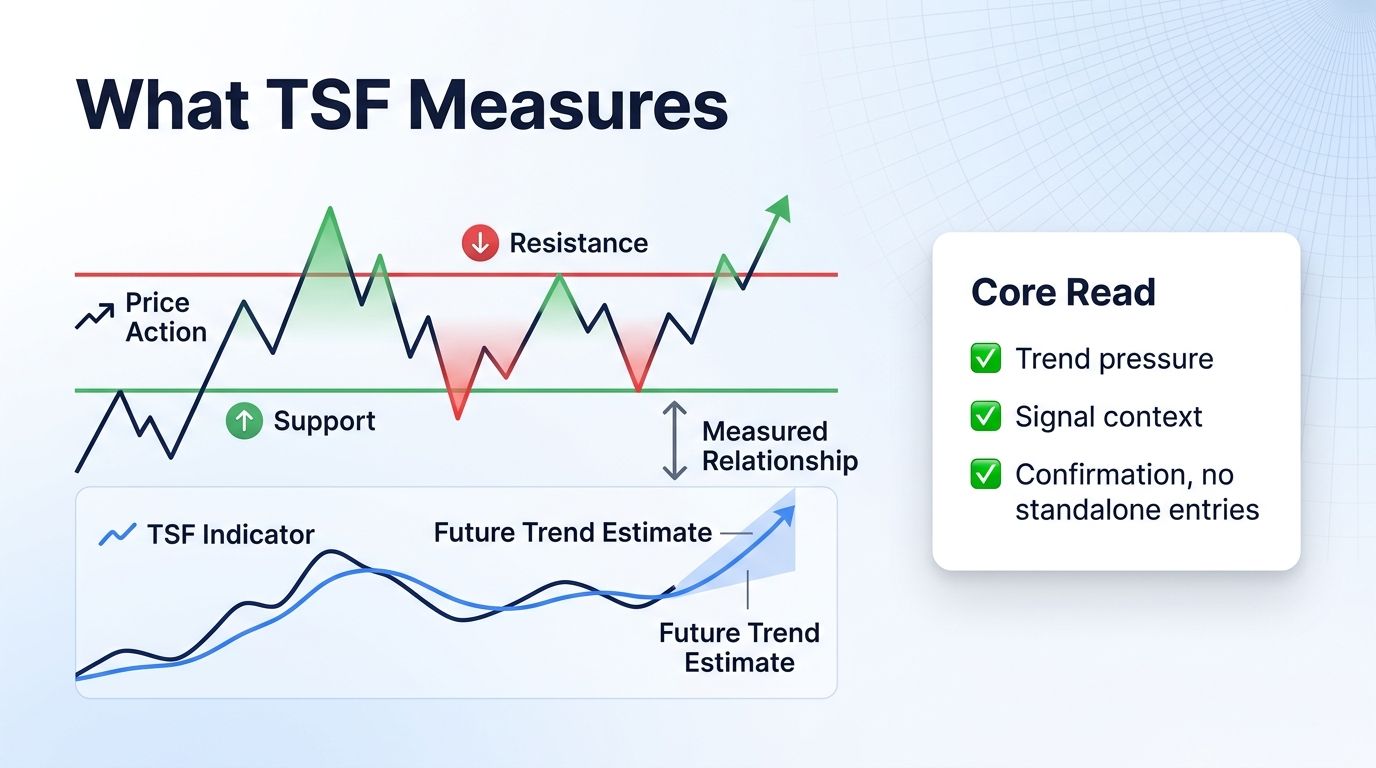
The Time Series Forecast, often shortened to TSF, measures a projected trend line based on linear regression of recent price data. That makes it useful for traders who want a cleaner read on trend pressure instead of reacting to every candle.
In crypto, the value of TSF is not that it predicts the future. Its value is that it organizes noisy price movement into a repeatable signal. A trader can then compare that signal with support, resistance, volume, and the broader market state.
The best way to use TSF is as a filter. It should help answer whether momentum is improving, fading, or simply moving sideways. It should not be treated as a command to enter every time a line changes direction.
- Use TSF to measure trend pressure.
- Confirm signals with price structure.
- Avoid using one indicator as a complete system.
- Review the signal on more than one timeframe.
How to Read TSF Signals
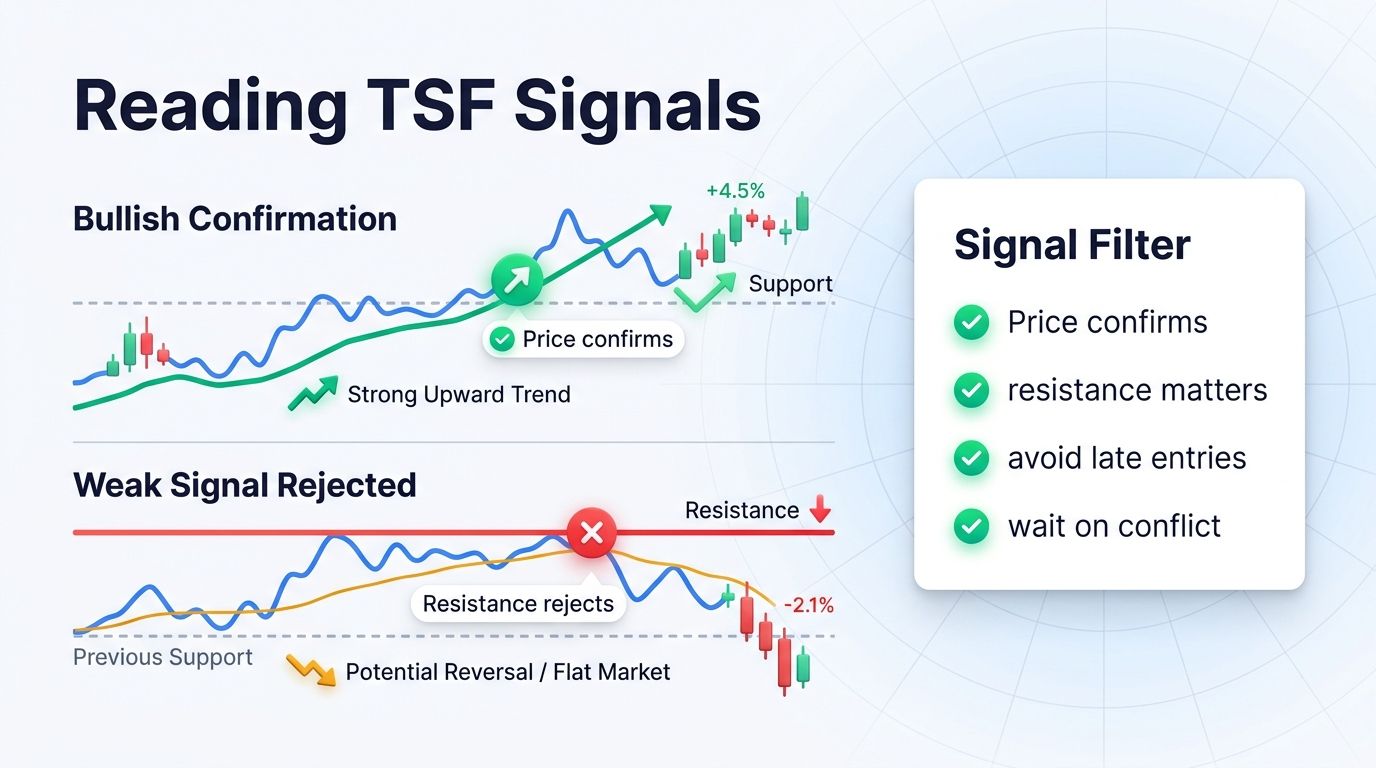
A constructive signal appears when the TSF line crosses above a moving average or price reclaims the forecast line with stronger volume. That does not mean the trade is automatically valid. It means the trader has a reason to check whether price action supports the same direction.
A defensive signal appears when the TSF line falls below its comparison average while price fails to regain the projected path. In that case, traders should reduce confidence in long setups, tighten review rules, or wait for a cleaner structure before adding risk.
Signals become more useful when they align with the chart. If TSF turns positive while price is still trapped under resistance, the setup is weaker. If price breaks structure and TSF confirms the move, the signal has more weight.
- Separate signal from trade entry.
- Check whether price confirms the indicator.
- Use resistance and support to filter late signals.
- Treat disagreement as a reason to wait.
When TSF Works Best in Crypto
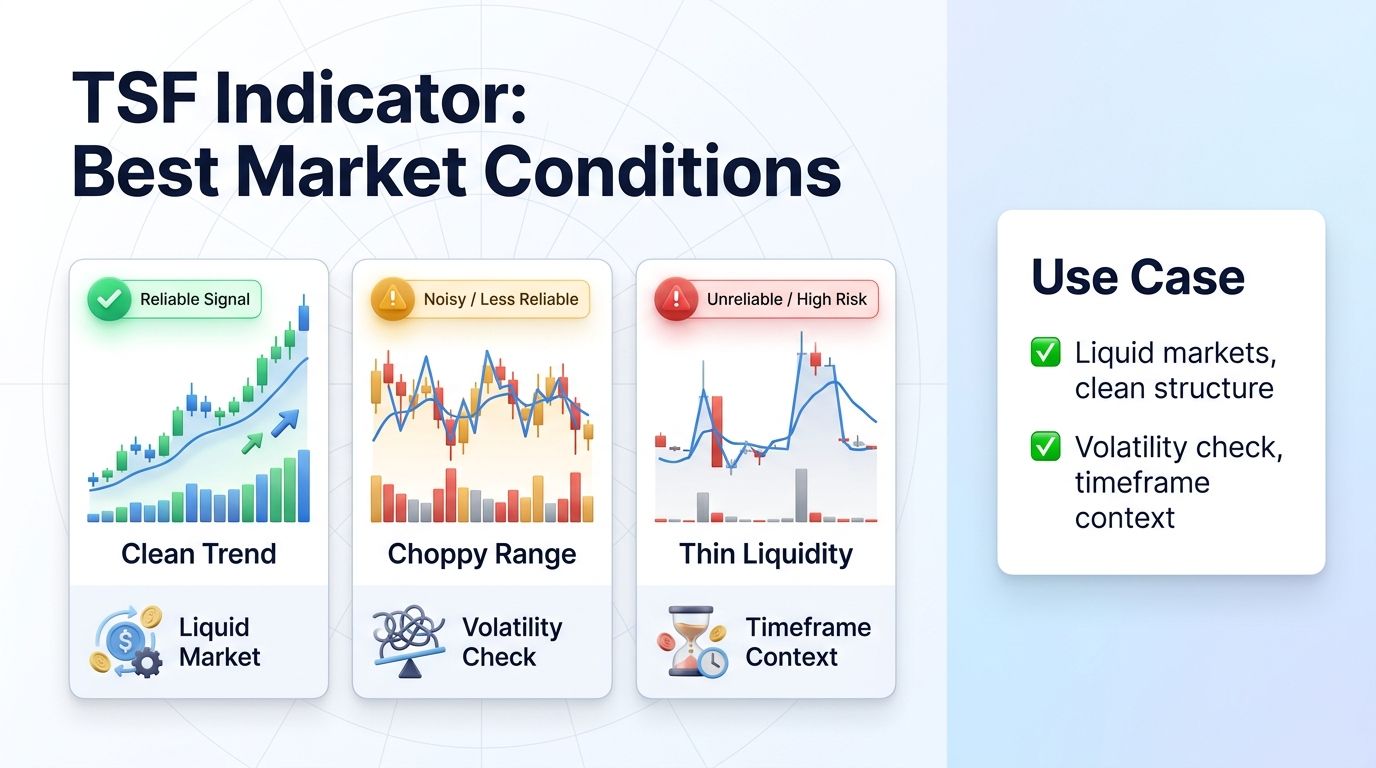
TSF works best in orderly trends where recent price data has enough structure for regression to be meaningful. In those conditions, the indicator has enough structure to summarize momentum without being pulled around by every random wick.
It works poorly in choppy reversals where yesterday's trend slope stops describing today's market. Crypto traders see this often on low-volume pairs, weekend sessions, and assets moving only because of short-lived headlines.
This is why liquidity matters. A signal on BTC, ETH, or another deep market usually carries more information than the same signal on a thin token. The indicator can only read the data it is given.
- Prefer liquid pairs.
- Avoid thin markets with messy candles.
- Check volatility before trusting the signal.
- Use higher timeframes for cleaner context.
How to Combine TSF With a Trading Workflow
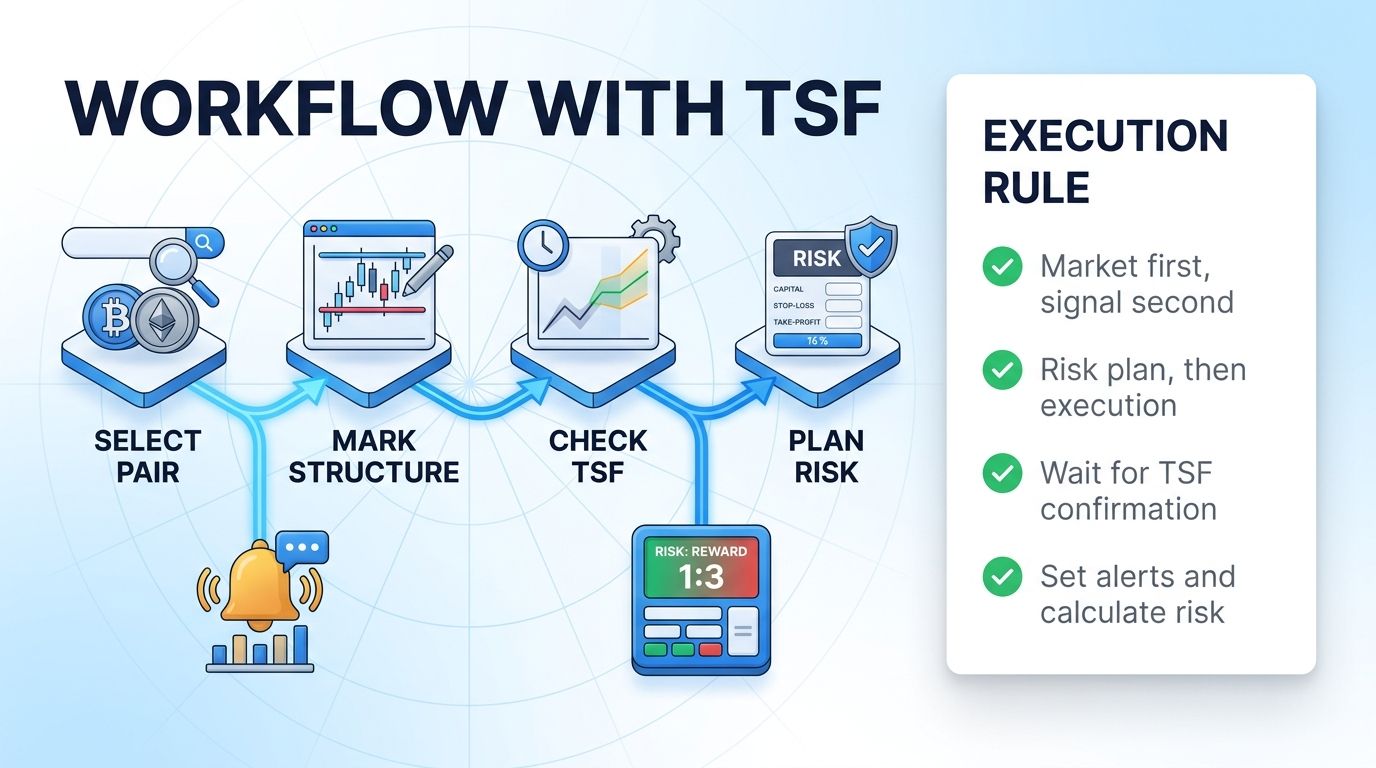
A practical workflow starts with market selection. Choose liquid pairs, mark the trend, and decide whether the asset is in a trend, range, or transition. Only then should TSF be used to refine the read.
Next, compare TSF with linear regression channel. If both tools point in the same direction and price is near a reasonable level, the setup becomes easier to evaluate. If they disagree, the signal is probably not clean enough for a new position.
Altrady traders can keep this workflow simple: create alerts around key levels, review the indicator on the chart, and use Smart Trading only after the entry, stop, and target are planned. The Risk Reward Calculator should come before execution, not after the position is live.
- Select the market first.
- Use TSF as a trend or momentum filter.
- Compare with linear regression channel or price structure.
- Plan risk before using Smart Trading.
Common TSF Mistakes to Avoid
The first mistake is treating TSF as a prediction engine. It is a structured reading of recent price behavior, not a guarantee. The signal can be useful and still fail when market conditions change quickly.
The second mistake is ignoring chart location. A bullish signal directly below resistance is very different from a bullish signal after a clean reclaim. A bearish signal after a large drop can also arrive too late to justify chasing the move.
The third mistake is skipping risk planning. Indicators help with analysis, but the trade still needs invalidation, position size, and a realistic target. Without those pieces, even a clean signal can become a poor trade.
- Do not treat indicator signals as predictions.
- Filter every signal by chart location.
- Avoid chasing signals after large moves.
- Define invalidation before entry.
A Simple TSF Review Checklist
Before using TSF on a live setup, write a short checklist. Start with the pair, timeframe, market state, and the exact signal you are waiting for. This prevents the indicator from becoming a vague excuse for a trade that was already emotional.
Then define what would prove the TSF read wrong. That might be a failed reclaim, a close back below support, a break of the trend line, or a change in volume behavior. The point is to decide before the candle moves, not after the loss is already uncomfortable.
Finally, record the result after the trade or after the skipped setup. Over time, that review shows whether the indicator actually helps your process or only adds visual confidence. A useful indicator should improve decisions, not decorate the chart.
- Write the timeframe and market state.
- Define the exact signal before entry.
- Plan what would invalidate the read.
- Review skipped setups as well as taken trades.
Bottom Line
The Time Series Forecast is useful because it turns recent trend slope into a forward-looking reference line without pretending to know the future. That makes it a practical addition to a technical toolkit for traders who want more than a basic moving average read.
The cleanest use is not to trade every TSF signal. Use it to narrow attention, confirm momentum, and decide whether the chart deserves more work. The final decision should still come from price structure, liquidity, and risk-reward.
In crypto, that discipline matters more than the indicator choice. A simple tool used consistently is usually more valuable than a complex tool used impulsively.
- Use TSF as a decision support tool.
- Combine it with structure and liquidity.
- Plan entries before execution.
- Let risk-reward decide whether the setup is worth trading.
FAQ
What is the Time Series Forecast?
The Time Series Forecast is a technical indicator that measures a projected trend line based on linear regression of recent price data. In crypto trading, that helps turn noisy candle movement into a cleaner read of trend pressure, momentum, or smoothing behavior. It does not predict the next candle by itself, but it gives traders a more consistent way to compare current price action with the broader market structure.
Is TSF a buy or sell signal by itself?
No. TSF should be treated as a decision support tool, not a standalone entry trigger. A signal becomes more useful only when price structure, support and resistance, liquidity, volume, and the higher timeframe point in the same direction. If those pieces disagree, the cleaner choice is usually to wait instead of forcing a trade from the indicator alone.
What market conditions fit TSF best?
TSF works best in orderly trends where recent price data has enough structure for regression to be meaningful. It is less useful in choppy reversals where yesterday's trend slope stops describing today's market, because the signal can flip, lag, or react to noise instead of meaningful trend behavior. Before trusting the indicator, check whether the pair has enough liquidity, whether the timeframe is clean, and whether the current market is trending, ranging, or transitioning.
How should crypto traders use TSF in Altrady?
Use TSF as part of a repeatable review process in Altrady. Start by checking the indicator against the chart structure, then set alerts around the levels where the signal would matter. Before using Smart Trading, define the entry, invalidation level, target, and position size with the Risk Reward Calculator so the trade has a plan before execution.