The double bottom pattern is one of the most reliable chart patterns in crypto trading. It indicates a reversal of a downtrend and the start of a new uptrend. But how to effectively interpret it and use it in your trading strategy?
Read the detailed guide below and find out how you can leverage this pattern to enhance your trading skills and make informed investment decisions.

How to Confirm the Double Bottom Pattern on the Chart
First off, closely analyze the price chart, notice where the pattern starts to form, and the preceding downtrend. Then, follow these steps:
- look for the support and resistance levels.
- the lows should be at least a few weeks apart and the peak should not be higher than the previous downtrend.
- draw a horizontal line connecting the peak of the pattern, which is also called the neckline; this line represents the resistance level that the price has to break above to confirm the reversal.
- wait for the price to break above the neckline with a strong candlestick; this signals that the buyers have overcome the sellers and a new uptrend is likely to begin.
- measure the height of the pattern from the lowest point to the neckline and project it upward from the breakout point; this gives you an estimate of the potential target price for the reversal. You can then project this distance from the breakout point to get your target profit.
For example, if the lowest point of the troughs is $50 and the highest point of the peak is $60, then the height of the pattern is $10. You can then add $10 to $60 to get your target profit of $70.
- you’ll know for sure that the double bottom pattern is complete when the price breaks above the neckline with a strong volume; this signals that the buyers have overcome the sellers and that the downtrend has reversed. The price target for the double bottom pattern is calculated by adding the height of the pattern (the distance between the neckline and the lowest bottom) to the breakout point.
- always pay attention to trading volume; an increase in volume during the pattern's formation and confirmation can bolster the reliability of the reversal. That’s why it’s also recommended to add a volume indicator to the chart to bolster the pattern's confirmation.
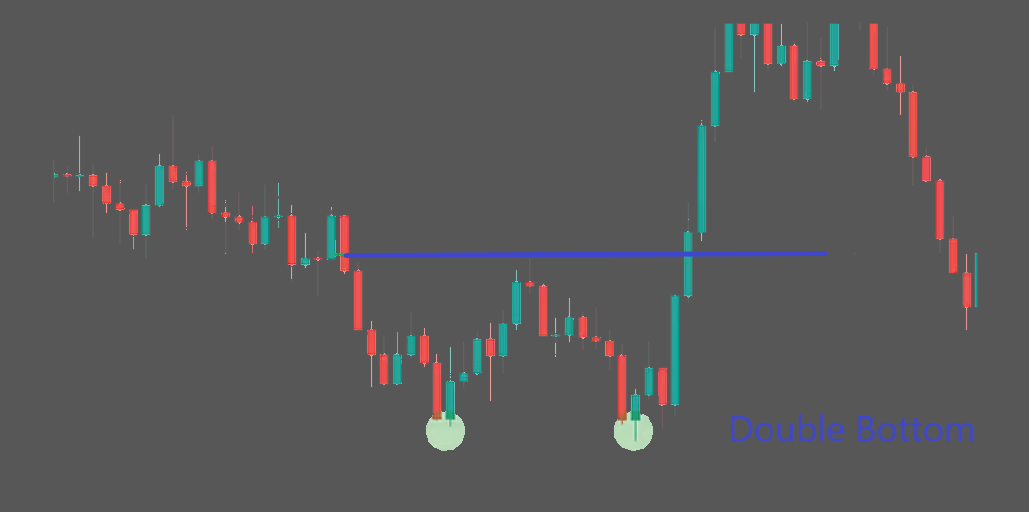
How to Interpret the Double Bottom Pattern
First low – the initial hint of price reversal
Following a significant period of decline, the market goes through an upward bounce. Then, it forms a "swing low" – a point where the price falls below all recent price levels within a specific timeframe, like the lowest price observed in the past week. It's important to note that, at this point, this could be just a retracement within the overall downtrend and not necessarily an indication of a full-fledged price trend reversal.
Second low – a closer look at the price reversal
The formation of a second low occurs as the market begins to discount the preceding downtrend, accompanied by a surge in buying pressure. As this secondary bottom is visible, it presents clear signals of a potential price reversal and an emerging uptrend. Yet, it's still no guarantee that the prices will keep increasing.
The neckline – a strong barrier
The neckline, often referred to as a resistance level, represents the maximum price an asset can attain during an upward-trending market phase. When the price goes above the neckline, it means there’s an imbalance in favor of buyers over sellers. This development suggests that the prevailing trend is likely to persist, pushing prices higher.
How To Use The Double Bottom in Your Trading Strategy
You can use the double bottom pattern as a:
- buying strategy – when the downtrend is coming to an end
- selling strategy – when the price has reached its peak and the uptrend may be ending
For entry, consider buying when the price breaks above the peak formed after the first bottom. This is a strong indication that the trend is reversing.
For an exit strategy, set a target price based on the distance between the bottoms and the peak. This distance can provide an estimate of the potential price movement.
Implement stop-loss orders to mitigate risk. Place a stop-loss just below the second bottom, ensuring that you protect your investment in case the pattern doesn't play out as expected.
Use more than one time frame to analyze the double bottom pattern. This can help confirm the pattern's strength and increase the probability of a successful trade.
Monitor the price movement and adjust your trade accordingly. It’s also recommended to use other technical indicators, like MACD or RSI, as they allow you to detect the trend low. You can also employ candlestick chart analysis to get additional reversal signals to buy, like hammer, morning star, bullish engulfing, and other candlestick patterns.
Let’s imagine a trading strategy based on a real-life example:
Bitcoin was in a downtrend from May to July 2021, reaching a low of $34,000 on May 17. This marked the first bottom of the double bottom pattern. The price then rallied to $39,000 on June 7th, forming the neckline. The price then corrected to $35,100 on July 5th, forming the second bottom. Next, the price surged to $62,900 on October 11th, breaking above the neckline with a high volume. This confirmed the double bottom pattern and signaled a bullish reversal.
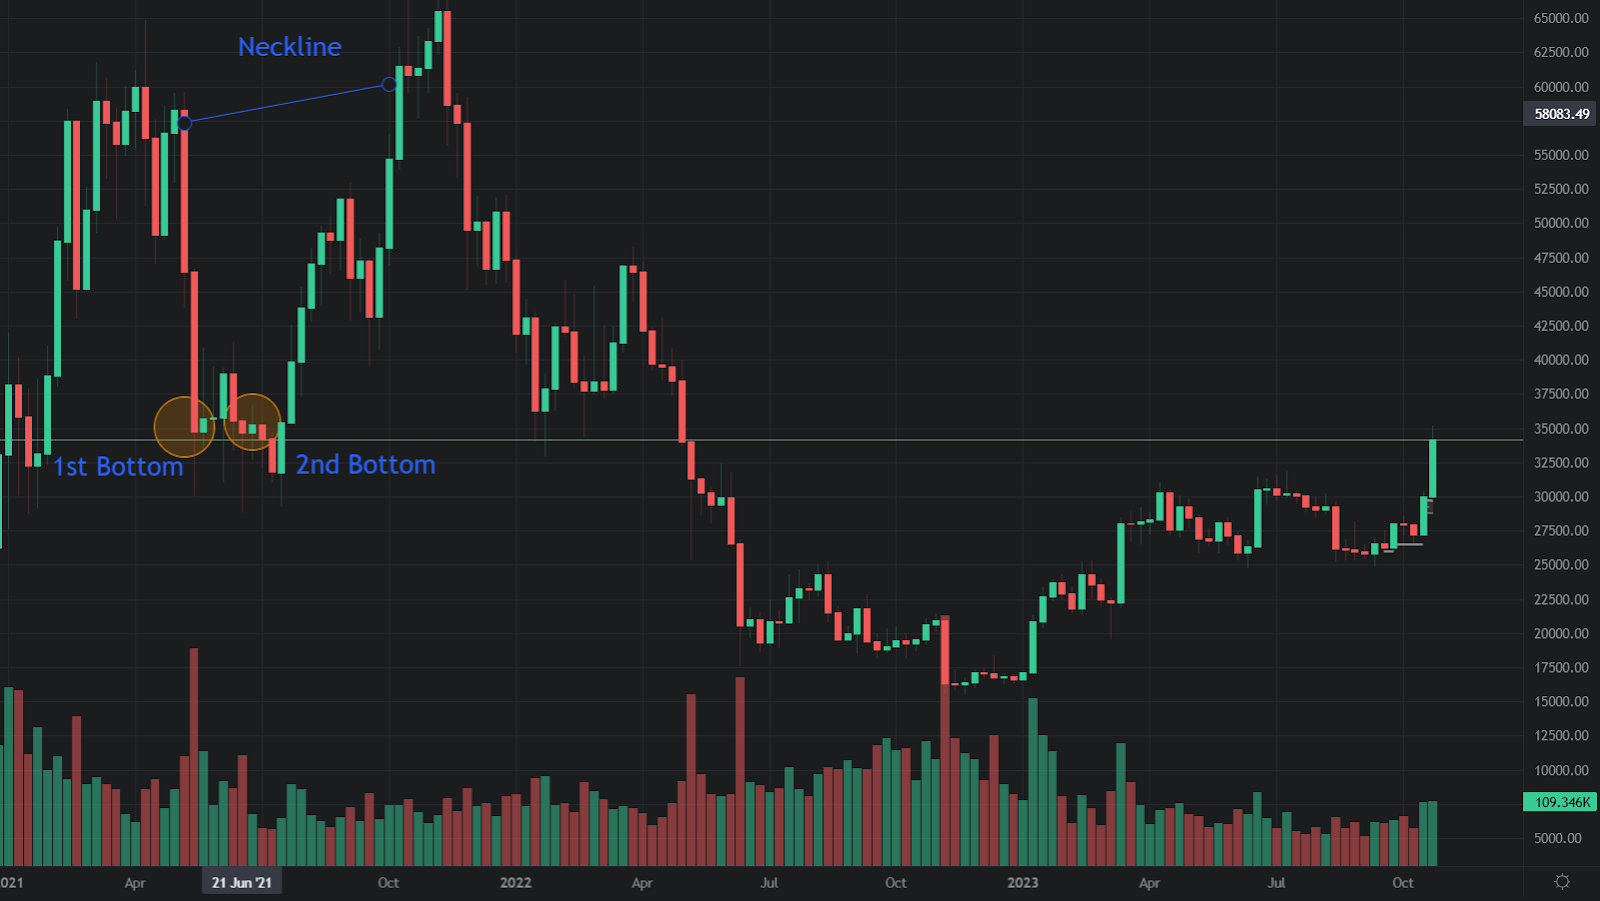
A profitable trading strategy in this case would’ve meant entering a pullback to $42,900 (which occurred on August 9). You could’ve placed a stop-loss order below $29,300 or below $40,900 (whichever was lower). Additionally, you could’ve placed a take-profit order at $54,700, which was calculated by adding $12,100 (the pattern’s height) to $42,600 (the breakout point). Alternatively, a trailing stop-loss order could’ve been used to capture more profits as Bitcoin continued to rise.

Conclusion
The double bottom pattern is a powerful tool for identifying and trading reversals in downtrends. Remember that like any pattern, it has its pitfalls and false breakouts can occur. Therefore, you should always have a trading plan and follow it strictly.
Additionally, you should always use other technical indicators and technical analysis tools to confirm your signals and manage your risk.