The rounded bottom pattern is one of the most difficult patterns to spot and trade, as it requires patience and discipline to wait for the confirmation of the breakout. At the same time, it’s one of the most reliable reversal patterns in technical analysis, indicating a strong and sustained change in market direction and psychology.
Check out all the details on how to use and interpret the rounded bottom pattern in crypto trading. Learn how to spot opportunities to buy low and sell high and take advantage of the bullish momentum.

Spot and Confirm the Rounded Bottom Pattern
Before knowing how to interpret and trade the rounded bottom pattern, you need to clearly identify it on the price chart. Follow these steps:
- analyze historical price data: look for a gradual decline followed by a gradual increase in price over a considerable time frame of the cryptocurrency you’re interested in. Pay attention to the shape of the price movement and the corresponding volume levels.
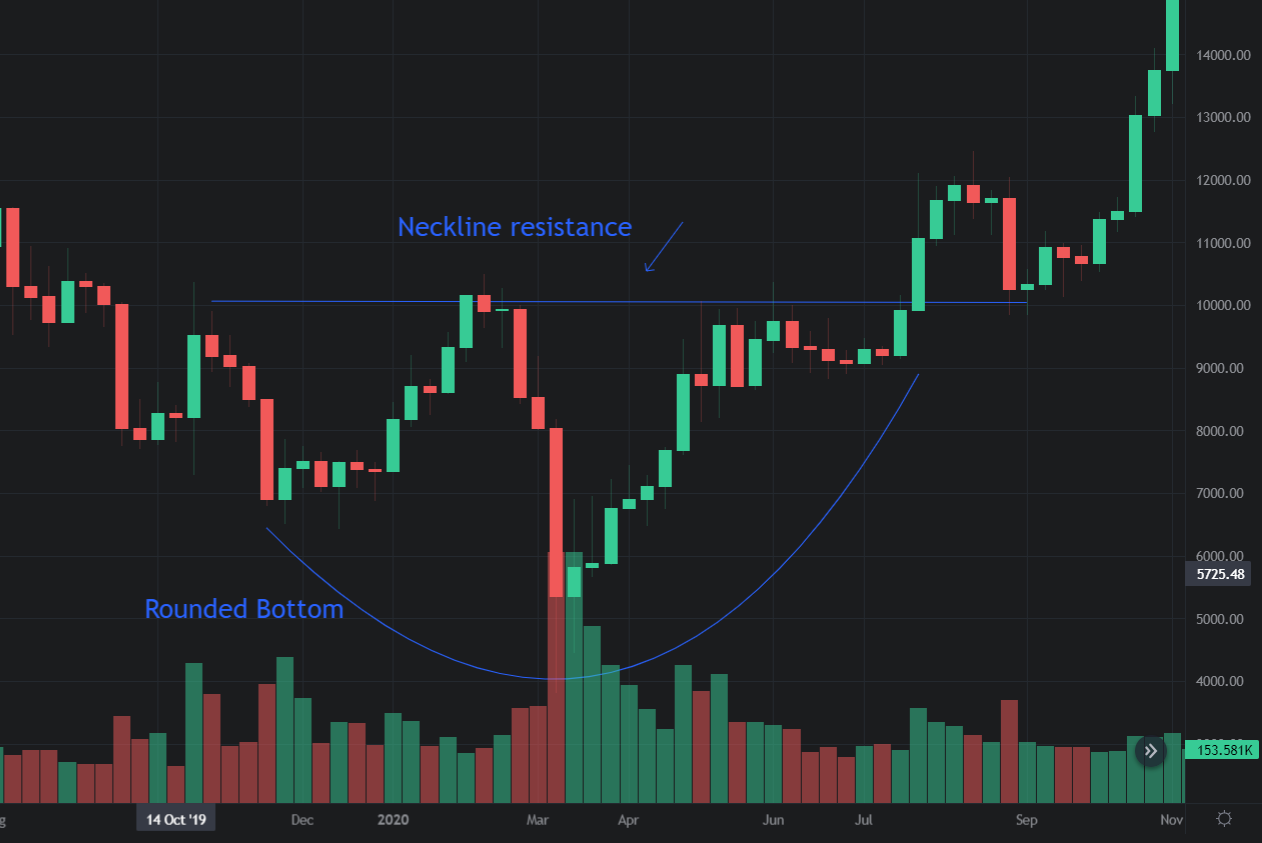
- draw trendlines: connect the lower points of the pattern and the upper points of the pattern. these trendlines will help visualize the U-shaped formation and provide a clearer picture of the pattern's strength.
- confirm volume patterns: volume confirmation is vital; that’s why you should check if the trading volume follows the expected pattern of decreasing during the price decline phase and increasing during the price increase phase. The volume should support the formation of the rounded bottom pattern.
- consider additional indicators: while the rounded bottom pattern itself can be a strong signal, it’s recommended to consider additional technical indicators like moving averages, relative strength index (RSI), or MACD (Moving Average Convergence Divergence) to confirm the pattern's validity and identify potential entry and exit points.
How to Interpret the Rounded Bottom Pattern
The rounded bottom pattern usually forms after a prolonged downtrend, when the market is in a bearish mood and the sellers are in control. It means that investor expectations and market sentiment shift from bearish to bullish. The price reaches a low point and then starts to gradually rise, forming a curve that resembles the bottom of a bowl. While the pattern starts to form its curve, it’s very common that you see the price moving sideways or consolidating for a period.
The gradual rise indicates that the selling pressure is decreasing and the buyers are slowly gaining confidence. However, the sellers aren’t completely out of the picture yet. They may still try to push the price down, creating minor fluctuations along the curve. This is why the rounded bottom pattern takes a long time to form, typically weeks or months.
Once the breakout goes above the resistance level, the pattern is complete. This breakout signals that the buyers have finally overcome the sellers and that a new uptrend has begun. It also reflects a gradual change in psychology, as the market transitions from fear to hope and then to greed. The buyers who were previously cautious and skeptical become more confident and enthusiastic, driving the price higher.
Understanding the Time Frame of the Rounded Bottom Pattern
When analyzing the rounded bottom pattern, it’s essential to consider the time frame in which it’s forming. This pattern can occur on various time scales, ranging from daily charts to weekly or even monthly charts. You should be aware that the significance and reliability of the pattern can vary based on the time frame being considered.
For instance, a rounded bottom pattern that forms on a shorter-term chart, like a daily chart, may have a higher probability of being a false signal or a temporary reversal. On the other hand, a rounded bottom pattern that develops over a longer period of several weeks or months usually carries more weight and offers a stronger indication of a potential upward trend reversal.
Relationship of Volume and Price in the Rounded Bottom Pattern
Trading volume can serve as a confirming factor for the rounded bottom pattern's validity. This pattern typically forms at the end of a prolonged downtrend, signaling a potential reversal in price direction.
Thus, it’s essential to observe how volume behaves. Ideally, volume should be highest during the initial decline phase of the pattern, indicating strong selling pressure and a climax in bearish sentiment. As the pattern progresses and approaches its bottom, volume should start to taper off, reflecting a decrease in selling pressure.
It’s crucial to observe an increase in volume as the price breaks out of the pattern's low point. This surge in volume suggests renewed buying interest and confirms the pattern's strength.
However, keep in mind that volume and price don't always move in perfect correlation. Sometimes, trading volume doesn't perfectly align with price movements within the rounded bottom pattern. However, keeping an eye on volume can provide additional insights and help you assess the pattern's reliability.
Crypto Trading Strategies Using the Rounded Bottom Pattern
One way to trade the rounded bottom pattern is to enter a long position when the price breaks above the resistance level with high volume. Draw the neckline or resistance level by connecting the highs of the previous downtrend.
The breakout indicates that the buyers have overcome the sellers and that there’s enough demand to push the price higher. You can then set a stop-loss order below the breakout point or below the low point of the pattern, depending on their risk tolerance and trading strategy. You can also set a target profit based on the pattern’s height, which you can measure by subtracting the low point from the resistance level. Alternatively, you can use other indicators or methods to determine when to exit their position.
Another way to trade the rounded bottom pattern is to enter a long position during the rounding phase when the price is still rising gradually. This can allow you to capture more of the potential upside of the pattern, but it also involves more risk and uncertainty. You should look for signs of increasing volume and momentum during this phase, as well as other bullish signals from other indicators or tools. You can then set a stop-loss order below a recent low or below a moving average that acts as support. You can also set a target profit based on your own analysis or preference.

Conclusion
The rounded bottom pattern can be a powerful signal for crypto trading, as it indicates a change in market sentiment and a possible trend reversal. However, the rounded bottom pattern isn’t guaranteed to result in a trend reversal every time it appears. It’s advisable to use it in conjunction with other technical analysis tools and indicators for more accurate predictions.
Stay vigilant and practice risk management while making trading decisions.