Both novice and seasoned crypto traders believe that the rounded top chart pattern is an enigmatic phenomenon. It's a technical analysis pattern that often goes unnoticed. Yet, understanding it can provide valuable insights into market trends and potential reversals.
Read the comprehensive guide below and find out what the rounded top chart pattern means in the world of crypto trading.

What is The Rounded Top Pattern
The rounded top chart pattern, also known as the "rounded reversal top" or simply the "rounded top," is a bearish chart pattern that suggests a potential trend reversal in crypto markets. It typically occurs after a prolonged uptrend and you can spot it on various chart timeframes, making it a versatile tool.
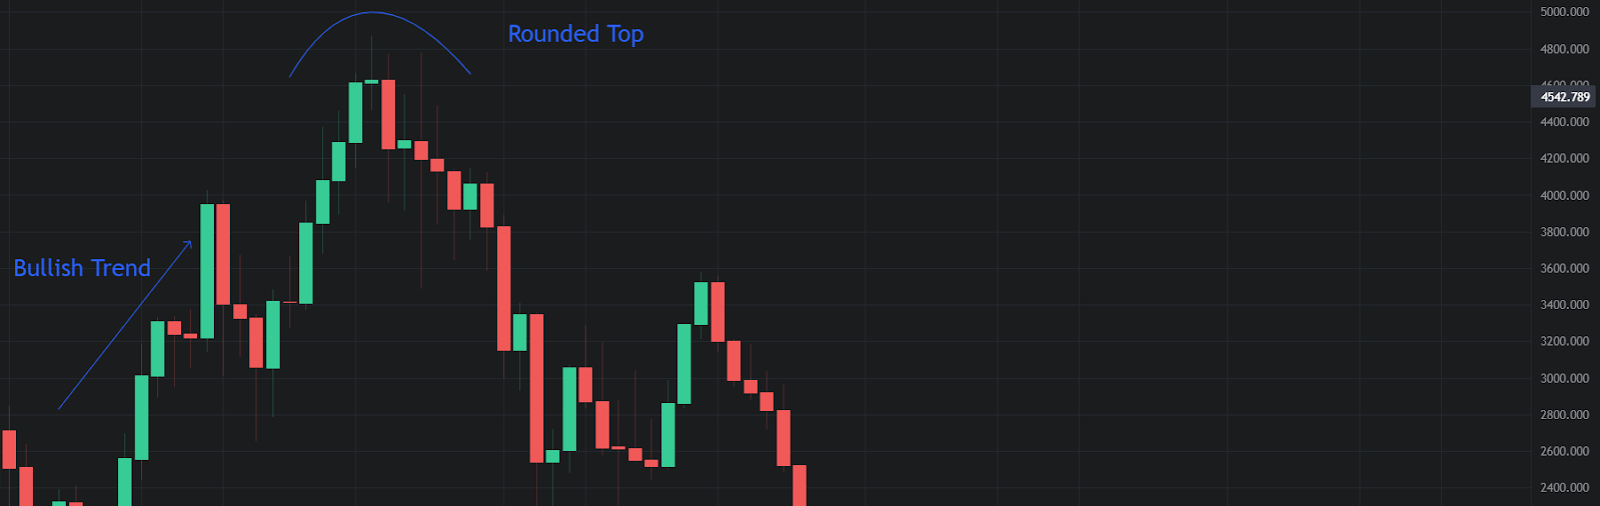
The rounded top chart pattern shows a gradual rise in price followed by a gradual decline in price, forming a rounded curve on the chart. In essence, this pattern tells you that the buying pressure is weakening and the selling pressure is increasing.
Still, before the pattern forms, it would be useful if you’d inspect a few details:
- the cryptocurrency should’ve been in an uptrend for a significant period; this means that the cryptocurrency's price would have been consistently increasing, forming higher highs and higher lows. This establishes the foundation for a potential reversal.
- the cryptocurrency's price should gradually reach a high point without any sharp spikes or sudden movements; this gradual ascent creates a visual pattern that can be easily recognized on a price chart.
How to Identify the Rounded Top on the Chart
Look for these key features to recognize the rounded top pattern on the price chart:
- gradual curve: the pattern is characterized by a gentle, rounded curve in the price movement, resembling the shape of an upside-down "U."
- extended uptrend: the rounded top usually forms after an extended period of bullish price movement, indicating the uptrend’s potential exhaustion.
- decreasing volume: as the pattern develops, you may observe a gradual decline in trading volume, indicating waning interest from market participants.
- neckline: the neckline is a horizontal support line that connects the lows within the pattern; a decisive break below this neckline is a strong confirmation of the bearish trend reversal.
The pattern is complete when the price breaks and closes below the neckline, signaling a bearish trend change.
What Does the Rounded Top Mean in Trading
The rounded top chart pattern can offer several valuable insights for traders, like:
1. Trend reversal signal
The primary meaning of the rounded top is its ability to signal a reversal from a bullish to a bearish trend. This can be an early warning for you to consider selling or shorting positions. You should watch for the price to break below the neckline before entering the market with a sell order.
2. Risk management
Recognizing the rounded top is also crucial for risk management. It helps you set stop-loss levels and adjust your positions effectively. Usually, it’s a good idea to place the stop loss above the neckline, while measuring the profit target by extending the pattern’s height down from the neckline.
Sometimes, along with the rounding top, you can also notice a double or triple top pattern. But the essential idea to keep in mind is that a potential change in trend could happen and that you should be cautious if you’re holding long positions.
Rounded Top Pattern Limitations
Be aware of the rounded top pattern’s limitations and challenges when trading:
- the pattern may take a long time to form, ranging from weeks to months or even years;
- the pattern may not be very clear or symmetrical on some charts, making it difficult to identify and draw;
- the pattern may fail if the price breaks above the neckline after breaking below it, invalidating the reversal signal;
- the pattern may not offer a favorable risk-reward ratio if the price has already moved too far from the neckline before breaking out.
Therefore, you should always use other technical indicators and tools to confirm your analysis and manage risks.

Conclusion
The rounded top chart pattern is a valuable tool if you want to identify potential trend reversals in crypto markets. The rounded top pattern indicates the end of an uptrend and the possible start of a downtrend, presenting an opportunity to go short.
Recognize the pattern’s key characteristics and understand its meaning, and you can make informed decisions and seize profitable trading opportunities.