The double top is one of technical analysis most common and reliable reversal patterns. It occurs when the price of an asset reaches a high point, retraces, and then rises again to the same level, forming a shape that resembles the letter M. The pattern shows that the bulls are losing momentum and the bears are ready to take control.
But how exactly to interpret and trade the double top pattern? Check out all the details below, so you can improve your chances of spotting profitable opportunities in the crypto market.

Spotting and Confirming the Double Top Pattern
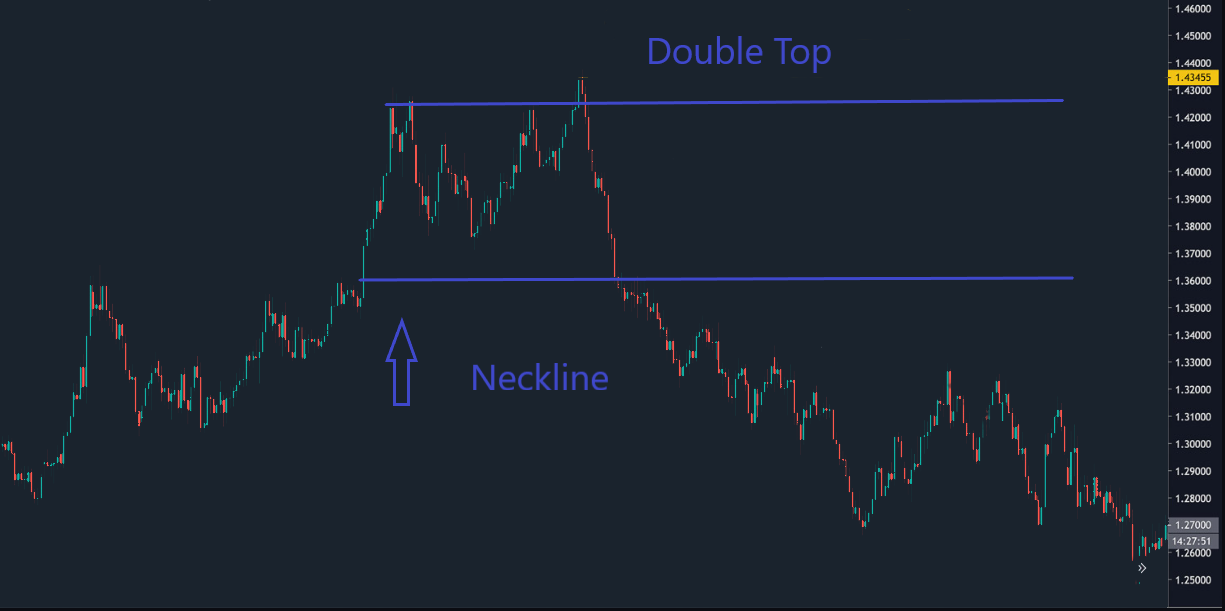
A double top pattern forms after a strong uptrend. It consists of two distinct peaks that reach a relatively equal high price level, separated by a trough. The pattern suggests a potential trend reversal, and that the asset's price will likely go down.
Look for these details to correctly identify the double top pattern on the price chart:
- two peaks that are roughly at the same price level;
- the two peaks are separated by a trough, which is a dip in price between the peaks;
- a decrease in trading volume as the pattern forms, indicating a loss of momentum;
- the "neckline" – a horizontal line drawn at the lowest point of the trough that serves as a critical support level.
Don’t Confuse Double Top With Similar Patterns
The double top pattern is very similar to the head and shoulders pattern, so here’s how to understand its unique characteristics to avoid false signals and potential losses.
In a double top pattern, you will see two peaks of similar height, while in a head and shoulders pattern, the middle peak (the head) is higher than the two surrounding peaks (the shoulders). Additionally, the neckline in a head and shoulders pattern is rather tilted, whereas in a double top pattern, it tends to be horizontal.
How to Interpret The Double Top Pattern
Entering trades too early based on a potential double top formation is a common mistake that you should avoid.
Here’s how to interpret double top and avoid its false signals:
- confirm with the support breakdown: wait for the price to move below the support level before considering a short position; this confirmation helps increase the probability of a successful trade and reduces the risk of entering prematurely. Additionally, set a stop-loss level above the second peak to protect against potential false breakouts.
- look for bearish candlestick patterns: these patterns strengthen the confirmation of a double top pattern; for example, a bearish engulfing pattern or a bearish shooting star candlestick can provide additional evidence of a potential downtrend.
- keep an eye on the trading volume: ideally, during the formation of the double top, you should see a decrease in volume as the price reaches the second peak; this decline in volume suggests a lack of buying interest and further strengthens the potential bearish reversal signal. However, if the second peak is accompanied by high volume, it may indicate strong buying pressure and cast doubt on the validity of the pattern.
- consider the overall market context: double tops are more reliable and have a higher probability of success when they occur in a strong downtrend; avoid trading against the prevailing trend, as it’s an increased risk.
- implement effective risk management: determine an appropriate position size and set realistic profit targets; avoid risking too much capital on a single trade, as it can lead to significant losses.
Trading Strategies with Double Top Pattern
Short Trading After the Neckline Break
One popular trading strategy with the double top pattern is to initiate short trades after the pattern is confirmed with a break below the neckline.
When the price breaks below the neckline, it indicates a potential trend reversal, signaling that selling pressure may outweigh buying pressure. Traders can capitalize on this bearish signal by shorting the asset or entering into a put-options position.
To manage risk, traders may consider placing a stop-loss order above the recent swing high, providing a defined exit point if the price reverses and invalidates the double top pattern. Additionally, you can use technical indicators like the Relative Strength Index (RSI) or Moving Average Convergence Divergence (MACD) to confirm the bearish momentum and increase the probability of a successful short trade.
Place Small Trades Considering the Profit Potential
This strategy involves entering into multiple positions with smaller trade sizes rather than a single large position.
By placing smaller trades, you can manage risk more effectively and have the flexibility to add to your positions if the pattern continues to develop. This approach also allows you to capture profits at different levels as the price moves downward, maximizing your potential returns.
To determine the profit potential, you can use various techniques:
- measure the distance between the peaks and the neckline and project it downwards from the neckline breakout point; this provides an estimation of the potential price target for the reversal
For example, if the neckline is at $50 and the highest peak is at $60, then the height of the pattern is $10. If the price breaks out at $49, then the target price is $49 - $10 = $39.
- set profit targets accordingly, taking into account the risk-to-reward ratio and adjusting your position sizes for optimal risk management.
For instance, you can place a take-profit order near the target price to lock in their profits. If you want to enter a short position at $49, you can set a stop-loss order at $61 and a take-profit order at $39.

Conclusion
Understanding and knowing how to use and interpret the double top pattern enhances your crypto trading strategy.
Key takeaways:
- pay attention to three main elements: the two peaks, the neckline, and the breakout as a first step in interpreting the double top pattern
- confirmation is crucial in trading this pattern, so look for additional signs, like bearish candlestick patterns to confirm the pattern's validity
- combine your strategies with proper risk management techniques and additional technical analysis tools to increase the probability of success.