Identifying and trading the double top pattern can significantly enhance your trading prowess, offering a strategic advantage in the world of crypto.
As a signal to sell or enter short positions, the double top pattern stands as a prominent indicator of potential trend reversals or significant price movements.
Here’s everything you need to know about the double top pattern and its meaning on a price chart.

What is the Double Top Pattern
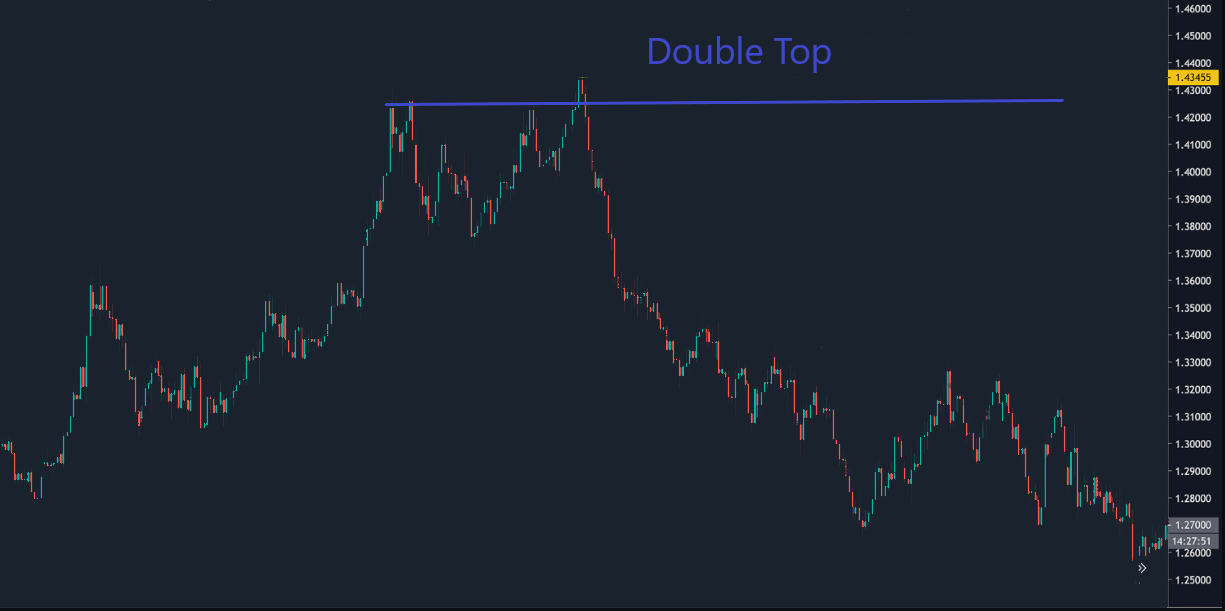
A double top is a bearish reversal pattern that occurs after a prolonged uptrend when a security's price reaches a high level twice but fails to break above it. What you’ll see on a chart is a price formation where a cryptocurrency’s price reaches a significant peak, then pulls back, and eventually rallies to the same peak again.
This formation creates a resistance level and suggests that the upward trend may be losing steam and a reversal is likely to come.
How to Spot the Double Top Pattern on a Chart
The key elements to identify the double top pattern effectively are:
The first peak
The formation of a double top begins with a strong uptrend in the market. This initial upward movement culminates in the creation of the first peak, often referred to as the "left shoulder." It represents a point where the asset's price reaches a significant high.
The temporary retreat
Following the formation of the left shoulder, the price experiences a temporary decline. This retracement is essential for the pattern to take shape. During this phase, traders should exercise caution and monitor the price action closely.
The second peak
Once the temporary retreat comes to an end, the price begins to rise again, forming the "head" of the double top pattern. This ascent is usually followed by another price decline, creating a trough. The subsequent upward movement results in the formation of the "right shoulder," which is approximately equal in height to the left shoulder.
The neckline
The critical element in identifying a double top pattern is the neckline. The neckline is a horizontal line drawn across the trough that connects the two low points of the pattern. It acts as a support level for the price.
The Meaning of the Double Top Pattern
A double top indicates that the uptrend has lost momentum and that the buyers are exhausted.
The outcome is sellers take control and push the price lower, creating a potential reversal in the trend. This shift in market dynamics can be attributed to a variety of factors such as profit-taking, waning investor sentiment, or the emergence of negative news. The pattern can occur on any time frame but is more reliable on longer-term charts.
The pattern’s implications include:
- reversal signal: it shows a potential trend reversal from bullish to bearish; traders use this signal to decide their exit from long positions or to consider shorting the asset.
- price target: the projected price decline from the neckline can be used to estimate the extent of the price drop; traders often measure the vertical distance from the neckline to the highest peak of the pattern. This distance is then projected downward from the neckline breakout point. This helps traders set realistic profit targets.
- confirmation: you should always wait for the price to break below the neckline to confirm the validity of the pattern and estimate the potential price decline.
- volume analysis: analyzing trading volumes during the pattern's formation can provide additional insight; the volume should decrease as the pattern forms. Then, you should notice an increase in volume during the second peak, indicating higher selling pressure and a stronger bearish signal.

Conclusion
The double top chart pattern is a valuable tool for traders and investors seeking to make informed decisions in the financial markets. Its ability to signal potential trend reversals and provide clear entry and exit points makes it a fundamental component of technical analysis.
Understanding the significance of a double top pattern in market trends is crucial for traders and investors. By recognizing this pattern and its implications, market participants can make informed decisions to capitalize on potential reversals and protect their capital.
To succeed in trading this pattern, it's imperative to combine it with other technical indicators, like oscillators, and moving averages. Additionally, stay informed about the broader market conditions. Remember that while the double top is a powerful tool, it's always advisable to consider a comprehensive approach to trading and risk management.