Every second counts in the fast-paced world of cryptocurrency trading. Yet, when it comes to the rounded bottom pattern, patience is key as it could take weeks or months to form and have the confirmation of its validity.
Here’s all you need to know about the rounded bottom pattern, its significance, and how it can help you make informed trading decisions.

What Is the Rounded Bottom Pattern
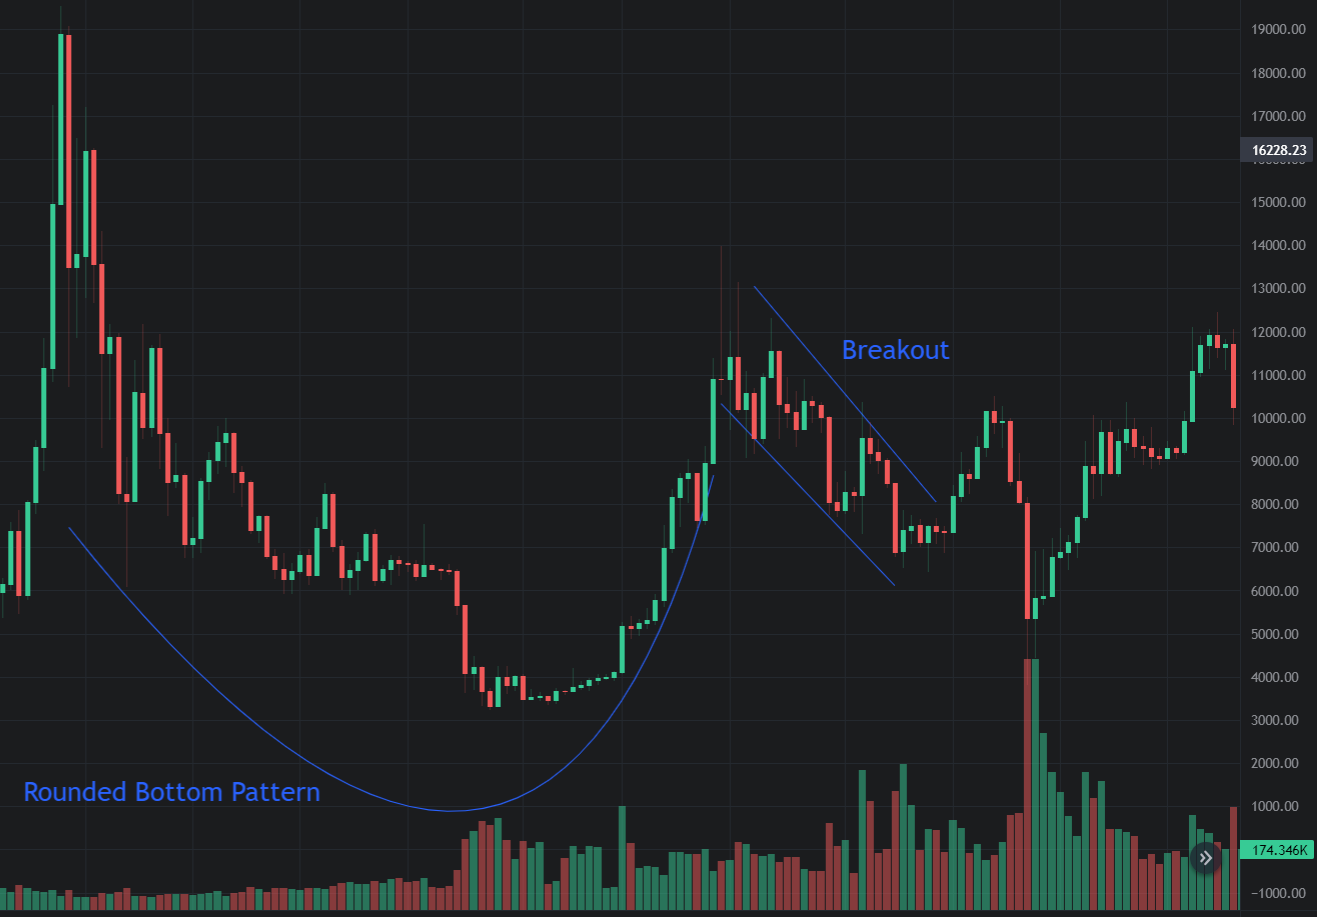
A rounded bottom is a chart pattern commonly used in crypto trading, and is also known as the saucer, the bowl, or the cup. It appears as a "U" shape on the price chart and indicates a potential reversal in long-term price movements.
This pattern typically forms at the end of a downtrend, suggesting a shift from bearish to bullish sentiment. Traders consider it a rare occurrence that can last for weeks or even months.
The pattern consists of a gradual decline in price, followed by a period of consolidation, and then a gradual rise in price.
How to Identify the Rounded Bottom Pattern
The rounded bottom pattern has some key characteristics that span over four phases. Here’s how to correctly identify it when analyzing a cryptocurrency’s price chart:
- downtrend (the 1st phase): the pattern starts with a prolonged downtrend, indicating a bearish market sentiment;
- gradual reversal (2nd phase): the price reaches a low point and the trend starts to reverse, but unlike other patterns, it happens gradually;
- U-shaped curve (3rd phase): the price begins to rise slowly and smoothly, forming a U-shaped curve, resembling the bottom of a cup;
- resistance breakout (4th phase): the price breaks through a significant resistance level, signaling a potential bullish reversal, marking the top of the previous downtrend.
*Important note: not every rounded bottom pattern leads to a successful breakout. Sometimes, the price may fail to break above the resistance level or fall back below it after breaking out. Therefore, you should always use other indicators and tools to confirm the validity and strength of the pattern, like volume, moving averages, trend lines, and support and resistance levels.
The Meaning of the Rounded Bottom Pattern
This pattern suggests that the downtrend is losing momentum and a possible trend reversal is imminent.
In the first phase, when the rounded bottom pattern starts to form, the cryptocurrency’s price falls steadily due to selling pressure. During the second phase, the pattern indicates that the selling pressure is weakening and the buyers are starting to enter the market. Unlike some patterns that show sharp price movements, the rounded bottom pattern demonstrates a gradual increase in prices over time.
When the pattern begins its rounding shape, the buyers are gaining momentum and the sellers are losing control. This is the time that the pattern suggests a reversal from a previous downtrend.
Once the price breaks above the resistance level, you get the confirmation that the trend has reversed and a new uptrend has begun. Still, you should also pay attention to volume as it plays a crucial role in confirming the validity of the pattern. Typically, during the rounding bottom formation, the trading volume tends to decrease as the price declines and increases as the price starts to rise. This volume confirmation adds strength to the pattern.
While some patterns may indicate short-term price movements, the rounded bottom pattern is often associated with longer-term trends. The rounded bottom presents good opportunities for traders who want to capitalize on sustained upward momentum.

Conclusion
The rounded bottom pattern is one of many technical analysis tools that can help crypto traders identify and exploit opportunities in the market. It can be a valuable tool for traders and investors in identifying potential market reversals.
What you need to keep in mind about the rounded bottom pattern is that it’s usually found at the end of extended downward trends and signifies a shift from bearish to bullish sentiment in the market. Additionally, it's essential to combine various strategies and use this pattern in conjunction with other technical indicators to make well-informed decisions.
Understand how to identify and interpret this pattern, and you’ll improve your chances of spotting profitable trading opportunities.