The rounded top pattern is a widely recognized chart pattern in technical analysis that indicates a potential reversal in the long-term price movement. As a crypto trader, it’s essential that you understand how to interpret it and determine an effective trading strategy using this pattern.
Read below and find out more about the various aspects of trading with the rounded top pattern.

Spot and Confirm The Rounded Top Pattern
Here’s how to correctly identify the rounded top pattern on the price chart:
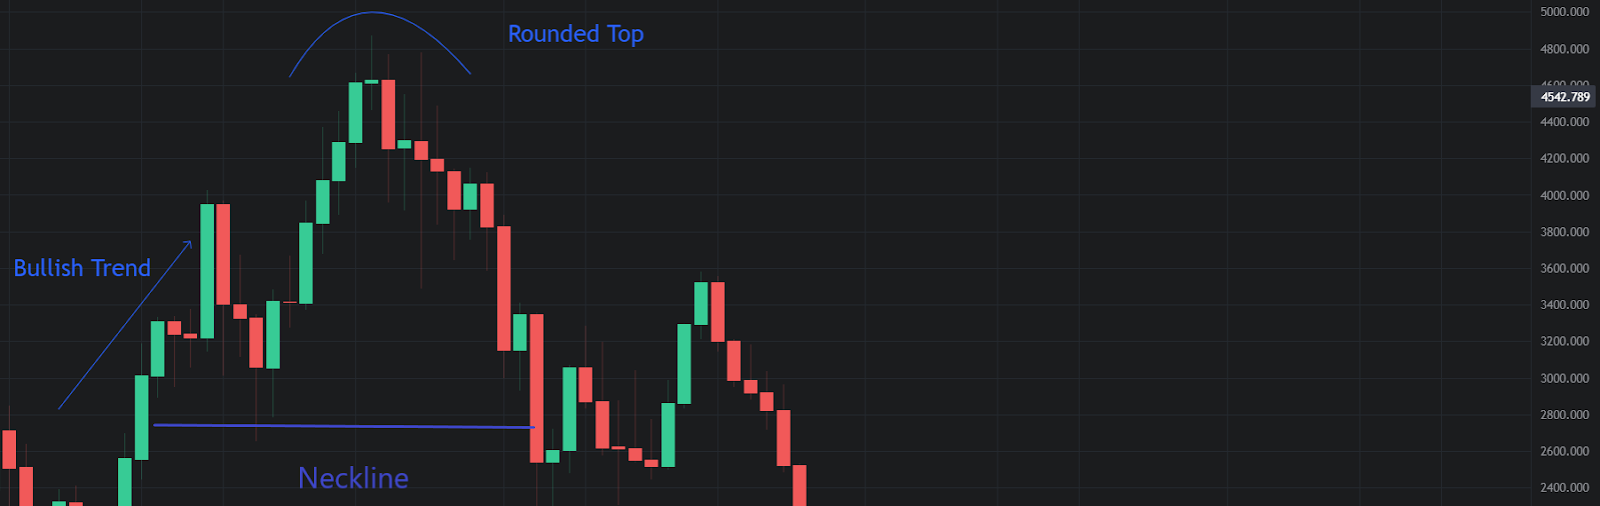
Step 1: Find a bullish trend
Look for a series of higher highs and higher lows on the price chart, indicating a bullish trend.
This trend can be identified by observing upward price movements or breakouts.
Step 2: Observe stalled price action
Wait for a period of extended price consolidation or a plateau in the price movement.
This phase represents a temporary pause in the bullish trend and is a key characteristic of the rounded top pattern.
Step 3: Draw the curved line
Connect the periodic highs of the price action with a curved line that approximates the upper extremes.
The curved line should resemble an inverted parabola, sloping downwards.
How to Interpret the Rounded Top Pattern
The psychology behind the rounding top pattern is that it reflects a shift in the sentiment of the market participants from bullish to bearish. The initial rise in price is driven by optimism and enthusiasm, as buyers outnumber sellers and push the price higher.
However, as the price reaches a peak, the buying pressure starts to weaken and the sellers gain more control. The price begins to fall slowly, as buyers lose interest and confidence, and sellers become more aggressive. The gradual decline in price indicates that there’s no panic selling, but rather a steady erosion of demand.
The price eventually breaks below the support level, confirming the reversal of the trend and signaling a bearish outlook for the future.
Interpreting the rounded top chart pattern requires a systematic approach. The steps you need to consider include:
1. Confirmation
The neckline’s break in the rounded top pattern is a significant event that traders should pay attention to. Wait for a clear break below the neckline to confirm the potential reversal in the long-term price movement, indicating a bearish outlook for the security.
This break should be accompanied by increased trading volume, further strengthening the signal.
2. Target price
Measure the pattern's height and subtract it from the neckline's breakout point. This will help you determine a target price and give you a potential target for the downward move.
Trading Strategies With The Rounded Top Pattern
When trading with the rounded top pattern, determining the profit target is essential. One common approach is to measure the distance from the highest point of the rounded top to the neckline. You can then use this measurement to identify a potential target for the downward price movement.
Your trading strategy using the rounded top pattern can either have an aggressive or a conservative approach.
The aggressive approach refers to entering a short position as soon as the price breaks and closes below the neckline. This break shows a potential reversal in the upward trend, indicating a possible downward movement in price. By entering a short trade at this point, you can take advantage of the anticipated decline in the security's value.
You can place a stop loss above a recent swing high and your target equal to the patterns’ height projected from the breakout point. This ensures that if the price breaks above the neckline, indicating a failed reversal, you can close the trade to minimize losses.
If you chose the conservative side, you should wait for the price to retest the neckline after breaking below it. Enter a short position when the price fails to break above the neckline and resume its downward movement. You should place your stop loss above the neckline and your target equal to the pattern’s height projected from the breakout point.
Just take note that the conservative entry method might not always work out and result in missing a setup.
Confirm your strategy with technical indicators
You should always combine the rounded top pattern with other tools or technical indicators, like moving averages or oscillators, to confirm your trading decisions. These indicators can provide additional signals and increase the accuracy of trading strategies.
Monitor your trade
Continuously monitor your trade and be prepared to exit if the market conditions change. If the subsequent price movement confirms the reversal, you can benefit from the downward trend by opening short positions or taking profits on existing long positions.
Beware of False Breakouts
The duration of the rounding top's formation is directly linked to the length of the ensuing downtrend, with more extended formations resulting in more substantial declines. Sometimes the rounding top will struggle to emerge. When the price falls below the rounding top’s neckline, and subsequently rises back to the neckline’s without breaching it, the formation of the rounding top falters.
In this situation, it's prudent to maintain your position, observe the market's indicators, and make your exit decision along with the prevailing trend.

Conclusion
Understanding and interpreting the rounded top pattern is crucial if you want to anticipate a significant change in trend. This price pattern, characterized by a downward-sloping curve, may indicate a reversal in the long-term price movement. Keep in mind that this pattern works best over longer timeframes.
You can use the rounded top pattern to take profits and protect yourself from buying into an unfavorable market or strategize to make money from falling prices by short-selling.