The double bottom pattern is a versatile tool you can apply to various financial markets, including cryptocurrencies. Since it helps you identify major shifts in the market trend and potential buying opportunities, this pattern is an invaluable asset in your toolkit.
Read the guide below and find out how to identify the double top pattern and its meaning in cryptocurrency trading.

What Does The Double Bottom Mean In Trading
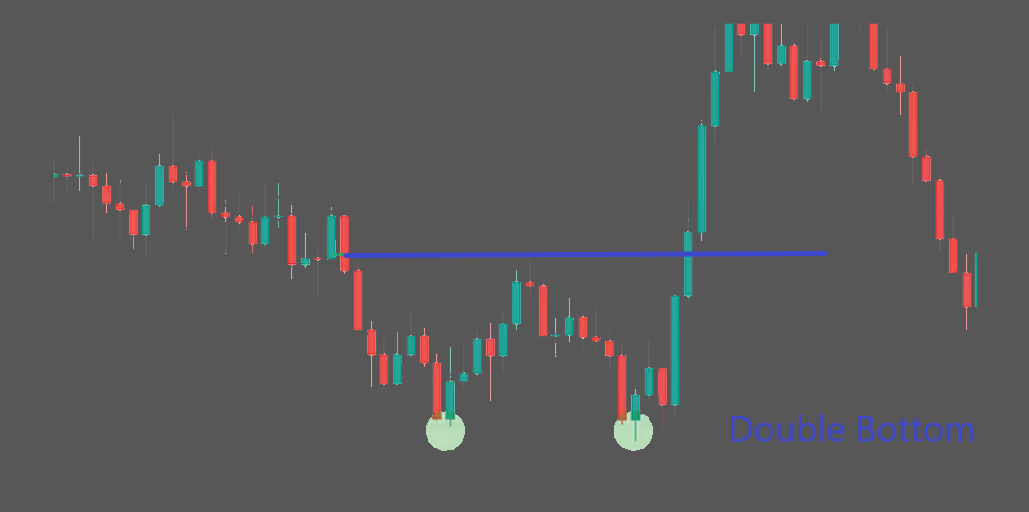
A double bottom is a technical analysis pattern that indicates a possible reversal of a downtrend and marks a new uptrend. It occurs when a crypto asset’s price drops to a low point, rebounds slightly, and then drops again to a similar or lower low point, before going back up. The two low points are the "bottoms" of the pattern, and the high point between them is the "neckline", overall resembling the letter 'W.'
You get the confirmation of the pattern when the price breaks above the neckline, signaling a change in the market sentiment from bearish to bullish.
Identifying the Double Bottom Pattern
Follow these steps to correctly identify the pattern:
1. Analyze the downtrend
You must first identify a clear downtrend. This is crucial as the pattern occurs after a prolonged price decline. The downtrend signifies the presence of strong selling pressure.
2. Look for the first bottom
The first bottom of the pattern forms when the price hits a low point and then starts to rise. However, this rise is usually not significant enough to signal a trend reversal. It's only the beginning of the formation.
3. Look for a peak
Following the first bottom, there’s typically a peak where the price temporarily rallies. This peak is essential in forming the double bottom pattern’s 'W' shape characteristic.
4. Spot the second bottom
After the peak, the price dips again but doesn't reach the same low as the first bottom. This higher low forms the second bottom of the pattern. It indicates that the selling pressure is weakening.
5. Get a confirmation
The double bottom pattern is confirmed when the price surpasses the peak formed after the first bottom. This breach of the peak is a strong signal that a bullish reversal is likely to occur.
Additional helpful tips that increase the reliability of the pattern are:
- the time span between the two bottoms plays a key role in its accuracy; the longer the duration, the greater the probability of the pattern being valid. That’s why you should analyze this pattern using daily or weekly price charts.
- the second bottom should be equal to or lower than the first one, as this shows a stronger capitulation by the sellers;
- the neckline should be horizontal or slightly downward sloping, as this indicates a more stable resistance level;
- an increasing volume during the breakout (when the price approaches the first bottom), as this shows a shift in momentum from sellers to buyers; similarly, during the pattern's completion, you’d have to notice a decrease in volume as the price approaches the second bottom. Lower volume indicates diminishing selling pressure, further supporting the anticipated upward price movement. If volume remains high or increases during the second bottom, it may raise doubts about the pattern's validity and could suggest a false signal.
The Significance of the Double Bottom Pattern
A double bottom price chart can be used by traders and investors to identify potential buying opportunities in a falling market. The logic behind the pattern is that the price has tested the support level twice and failed to break below it, indicating that the selling pressure is weakening and the buyers are gaining strength.
The neckline acts as a resistance level that the price has to overcome to confirm the reversal. The breakout above the neckline is usually accompanied by increased volume during the upward price movements. Higher volume suggests greater participation from market participants and strengthens the validity of the pattern.

Conclusion
The double bottom pattern is a powerful tool for crypto traders and investors, signaling a potential bullish reversal after a downtrend. By understanding the pattern's formation and implementing effective trading strategies, you can harness its potential for financial success.
Remember to use stop-loss orders, analyze trading volume, use daily or weekly price charts, and consider the duration between the two lows for a well-rounded approach to trading.