
Equilibrium in trading is the price where buying and selling pressure are in balance. In smart money concepts (SMC) and the ICT method, it has a precise meaning: the 50% level of a dealing range, halfway between a significant swing low and swing high. Price above equilibrium is in premium, which is expensive for buyers, and price below it is in discount, which is cheap, so traders use equilibrium to decide where to look for longs and where to look for shorts.
This chapter explains both meanings of equilibrium, how to draw it on a chart, how premium and discount work around it, how it relates to the optimal trade entry zone, and how to use it in a trade plan without treating it as a magic level. It builds on swing highs and lows and market structure.
Key Takeaways
- Two meanings, one idea: in economics, equilibrium is where supply meets demand; in SMC, it is the 50% midpoint of a dealing range, a working estimate of fair value.
- Premium and discount: above equilibrium is premium, below it is discount. With a bullish bias, look for buys in discount; with a bearish bias, sells in premium.
- Draw it from clear swings: anchor a Fibonacci tool from the last significant swing low to swing high (or high to low), and read the 0.5 level.
- It is a filter, not a signal: equilibrium tells you which half of the range to trade from, while order blocks, fair value gaps and liquidity sweeps give the entry.
- Balance and imbalance: markets alternate between ranges that trade around equilibrium and trends that leave it behind.
What Is Equilibrium in Trading?
The word comes from economics. The equilibrium price is the price where the quantity buyers want equals the quantity sellers offer, so the market clears with no pressure to move. In a live market, that balance is never fixed: news, liquidity and positioning keep shifting supply and demand, and price moves to find a new balance.
Technical traders use the idea in two practical ways:
- Balance areas: when price trades sideways in a range, buyers and sellers agree on value and the market is in equilibrium. A breakout from the range is an imbalance that starts a new move. See how smart money operates in ranging markets.
- The 50% level of a range: in smart money concepts, equilibrium is the exact midpoint of the current dealing range. This is the meaning most traders search for, and the rest of this chapter focuses on it.
Equilibrium in Smart Money Concepts
In the ICT and SMC approach, a dealing range is the price range between the most recent significant swing low and swing high on the timeframe you are analysing. Its 50% level is equilibrium, which ICT treats as fair value for that range. The logic is simple: if you want to buy, you want to buy below fair value; if you want to sell, you want to sell above it.
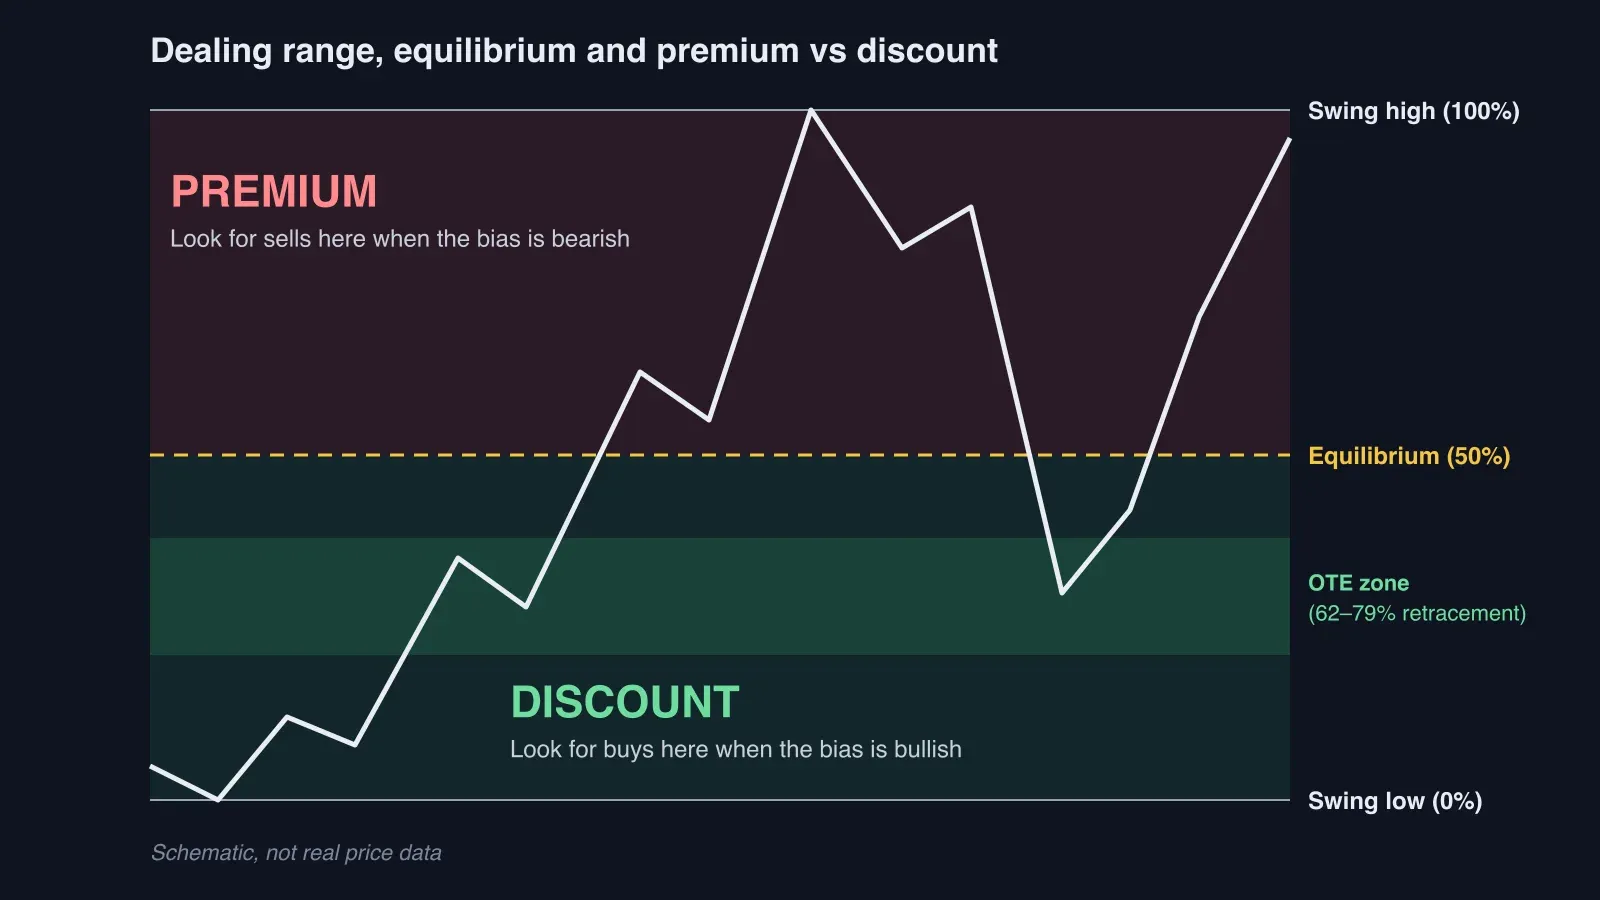
Schematic dealing range, not real price data. After the swing high, price retraces through equilibrium into discount before the next leg up.
| Zone | Where it is | What it means | How traders use it |
|---|---|---|---|
| Premium | Above 50% of the range | Price is expensive relative to the range | Look for sells when the bias is bearish; avoid new longs |
| Equilibrium | The 50% level | Fair value for the range | A reference and reaction level; no edge on its own |
| Discount | Below 50% of the range | Price is cheap relative to the range | Look for buys when the bias is bullish; avoid new shorts |
How to Find Equilibrium on a Chart
- Choose the timeframe for your bias: the daily or 4-hour chart for swing trades, the 1-hour or 15-minute chart for intraday trades.
- Mark the dealing range: pick the most recent significant swing low and swing high, ideally a range whose high or low swept liquidity or broke structure.
- Draw a Fibonacci retracement: in an up move, from the swing low to the swing high; in a down move, from the swing high to the swing low. The 0.5 level is equilibrium.
- Read the zones: everything between the swing high and 0.5 is premium, everything between 0.5 and the swing low is discount.
- Redraw when structure changes: when price breaks the range and forms a new swing, the dealing range, and therefore equilibrium, moves with it.
You can also calculate it directly: equilibrium = (swing high + swing low) ÷ 2. If BTC's range runs from 60,000 to 70,000, equilibrium is 65,000; above it is premium, below it is discount. These numbers are an illustration, not a forecast.
Equilibrium, Premium, Discount and the OTE Zone
Equilibrium splits the range in half, but many SMC traders look deeper into the discount or premium half for entries. ICT's optimal trade entry (OTE) is the 62% to 79% retracement of the swing, with 70.5% often used as the midpoint. In an up move, the OTE sits inside discount, below equilibrium; in a down move, it sits inside premium, above it.
The strongest setups usually combine location with a reason for price to react there: a discount fair value gap or bullish order block inside the OTE, after a sweep of sell-side liquidity. The PD array matrix ranks these premium and discount references, and points of interest and Fibonacci shows how to combine them with retracement levels.
How to Trade With Equilibrium
Equilibrium is most useful as a location filter inside a plan you already have. A typical bullish workflow looks like this:
- Set the bias on the higher timeframe: for example, a daily break of structure to the upside.
- Draw the dealing range and equilibrium of the last impulse leg.
- Wait for price to retrace below equilibrium into discount instead of chasing it in premium.
- Find a discount point of interest: an order block, fair value gap or old low that lines up with the OTE zone.
- Wait for confirmation on a lower timeframe: a liquidity sweep followed by a shift in structure.
- Place the stop beyond the swing low or the sweep, and target the premium side of the range, such as the swing high's buy-side liquidity.
The bearish version mirrors it: bearish bias, rally into premium, a premium point of interest, confirmation, stop above the high, target in discount. Equilibrium itself often acts as the first target or as a level where price pauses on the way through.
Illustrative workflow, not a recommendation or a real trade.
Common Mistakes
- Treating 50% as support or resistance on its own: equilibrium shows where value is, not where price must turn.
- Drawing the range from minor swings: a range anchored to noise gives a meaningless midpoint. Use swings that broke structure or took liquidity.
- Ignoring the higher timeframe: a discount on the 15-minute chart can sit deep in premium on the daily chart.
- Buying in premium because a setup looks clean: a bullish block above equilibrium is a lower-quality entry with a worse risk to reward.
- Never redrawing: once a new swing forms, yesterday's equilibrium is no longer the reference.
Using Equilibrium in Altrady
- Draw the range and the 0.5 level with Altrady's Fibonacci and drawing tools, and use multi-charts to keep the higher and lower timeframes side by side.
- Set price alerts at equilibrium and at the top of the OTE zone, so you know when price reaches discount or premium without watching the chart.
- Plan the whole trade in one smart order: entry in discount, a stop beyond the swing and take-profits at equilibrium and the range high.
- Practise first with backtesting and paper trading before you trade the approach with real money.
Frequently Asked Questions
What is equilibrium in trading?
Equilibrium is the price where buying and selling pressure balance out. In smart money concepts, it is the 50% level of the current dealing range, used as fair value to separate premium from discount.
What is equilibrium in SMC and ICT?
In SMC and ICT, equilibrium is the midpoint between a significant swing low and swing high. Price above it is premium, below it is discount, and traders prefer buys in discount and sells in premium in line with their bias.
How do you calculate equilibrium?
Add the swing high and swing low and divide by two, or draw a Fibonacci retracement across the range and read the 0.5 level. Redraw it when a new swing forms.
What are premium and discount in trading?
Premium is the upper half of a dealing range, above equilibrium, where price is relatively expensive. Discount is the lower half, below equilibrium, where price is relatively cheap.
Is equilibrium the same as the OTE?
No. Equilibrium is the 50% level, while the optimal trade entry is the 62% to 79% retracement, which sits inside discount in an up move and inside premium in a down move.
Does price always return to equilibrium?
No. Strong trends can run without retracing to the 50% level, and ranges can break before reaching it. Equilibrium describes where value is, so it needs confirmation and risk management like any other level.
What is the equilibrium price in economics?
It is the price where the quantity demanded equals the quantity supplied. In trading, a market near equilibrium tends to range, and a shift in supply or demand creates the imbalance that starts a trend.
Smart money concepts are a way of reading price, not a guarantee. Trading involves risk, including the loss of your capital. This article is not financial advice.