
They’re based on the opening, high, low, and closing prices of a given time period, like an hour, a day, or a week. Candlestick patterns can be classified into two main categories: continuation and reversal. Continuation patterns indicate that the current trend is likely to continue, while reversal patterns signal that the trend is about to change direction.
Below, we’ll take a closer look and explore a few candlestick patterns and how to apply them for crypto trading.
We’ll use Bitcoin / Tether (BTC/USDT) as a main example, which is among the most popular trading pairs. But you can apply these patterns to any cryptocurrency or other asset.

ENJ/BTC Bearish Engulfing Pattern
A Bearish Engulfing pattern is a reversal pattern that occurs when a large red candle engulfs a smaller green candle that preceded it. This indicates that the sellers have taken control of the market and are pushing the price lower. A Bearish Engulfing pattern is more significant when it appears at the end of an uptrend or near a resistance level.
Here is an example of a Bearish Engulfing pattern on the Enjin Coin/Bitcoin daily chart:
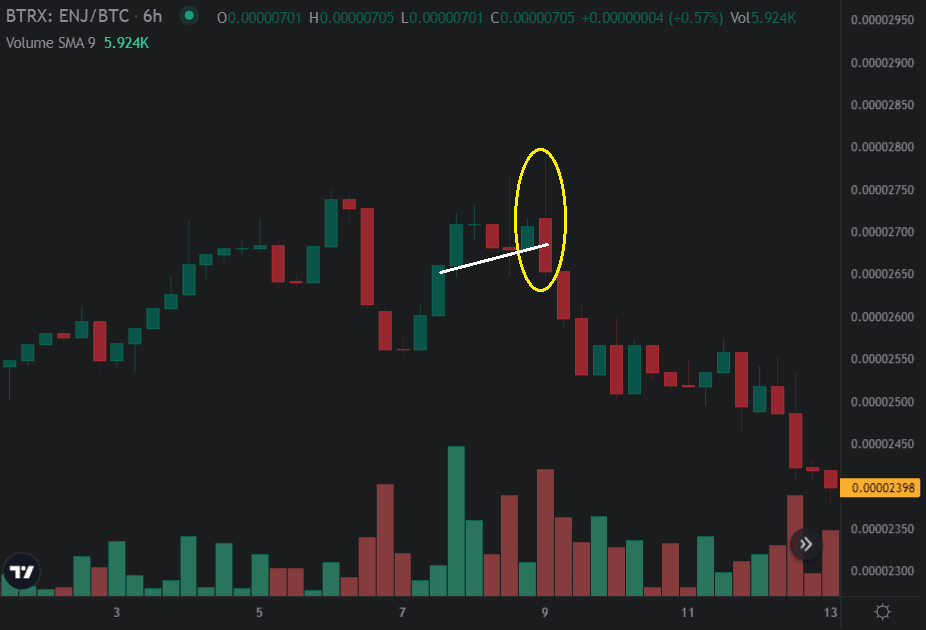
Here, the Bearish Engulfing pattern shows you a signal to go short around 0.00002700. The Bearish Engulfing pattern also engulfs more than one green candle, suggesting there are high chances for a downward move.
Following the Bearish Engulfing pattern, we see that BTC-USDT eventually broke below 0.00002700 and reached lows of around 0.00002398.
BTC/USDT Bullish Harami Pattern
The Harami candlestick is like an 'inside day' where the highs and lows of the candlestick are within the range of the previous candle. The Harami pattern is not as powerful as Engulfing Patterns in predicting a reversal, but it can slow down the market. The current trend often stops, but a new direction may take some time to form
The daily chart shown below illustrates a Bullish Harami pattern, which occurred on July 23rd.
Following the Bullish Harami pattern, the downward momentum slowed and the market rose from $29,800 to over $30,000.

Dark Cloud Cover
The Dark Cloud Cover is a two-candlestick formation that occurs at market tops after an uptrend. The first candlestick is a medium-sized green one, followed by a similar-sized red candlestick that closes near the lows of the trading session and well within the body of the green candlestick.
The daily chart for Bitcoin/Tether indicates a Dark Cloud Cover pattern. The red candlestick moves well below 50% of the green candlestick’s body, suggesting there’s a high chance that the signal will be accurate.
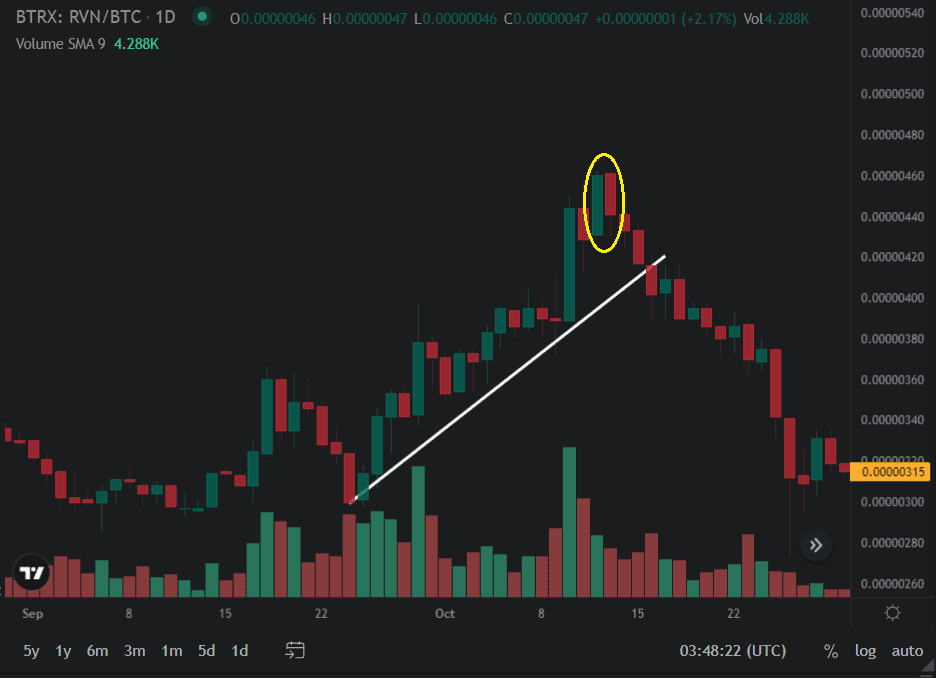
After the Dark Cloud Cover pattern, the price of Ravencoin fell from 0.00000470 once the pattern was formed to lows of 0.00000315 within a few hours. The high of the Dark Cloud Cover pattern can be used as a stop loss level.
Three Black Crows
You can recognize the Three Black Crows if you see three declining red candlesticks that close at or near their lows. The open of each candle is placed within the prior candlestick’s body and each candle should have small shadows or wicks (or none at all).
The daily chart below shows an example of Three Black Crows. Once you notice this pattern, you can enter a short position and use the highs of any of the three candles that make up the pattern as stop-loss levels.
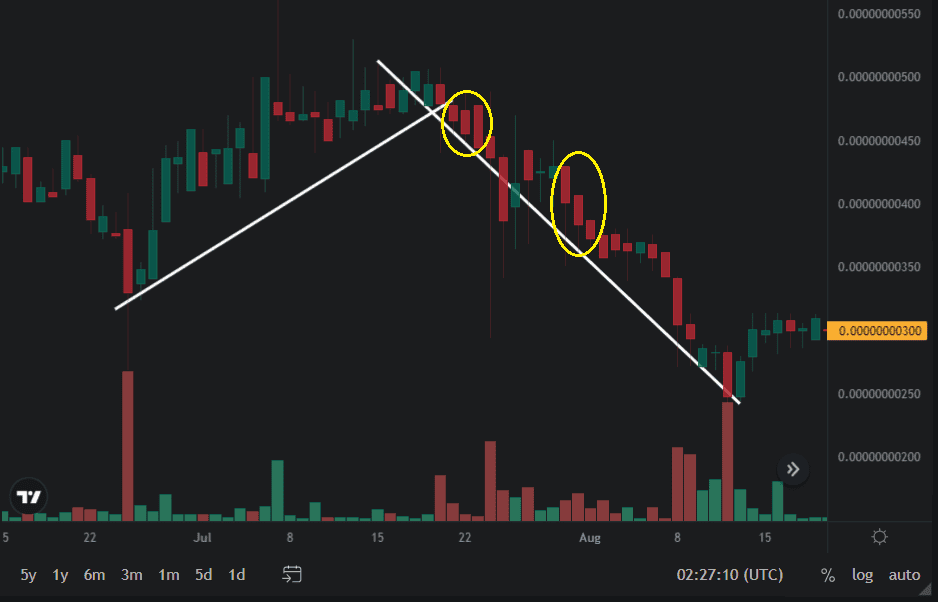
As you can see here, after the pattern was formed, the price consolidated around 0.00000450 and then proceeded to move lower towards 0.00000250 in just a few days.
Practical Applications of Candlestick Patterns in Crypto Trading
Here are some real-life applications of candlestick patterns in crypto trading:
Identify trend reversals
One of the primary uses of candlestick patterns is to identify potential trend reversals. For example, a bullish reversal pattern like the "Hammer" or "Bullish Engulfing" can indicate that a downtrend may be ending, potentially signaling a good entry point for a long trade.
Confirm trend continuation
Candlestick patterns can also be used to confirm the continuation of an existing trend. For instance, a "Bullish Marubozu" or a series of "Bullish Harami" patterns in an uptrend can suggest that the upward momentum is likely to persist, helping traders stay in winning positions.
Predict price volatility
Some candlestick patterns, such as "Doji" or "Spinning Top," indicate market indecision and potential price volatility. When these patterns appear after a strong trend, they can warn traders of a potential reversal or consolidation phase.
Determine entry and exit points
Traders often use candlestick patterns to identify entry and exit points for their trades. For example, a "Bearish Engulfing" pattern near a resistance level may signal a good time to exit a long position or even initiate a short position.
Manage risks
Candlestick patterns can also be used for risk management. By setting stop-loss orders or trailing stops based on key candlestick levels, traders can limit their potential losses if the market moves against their positions.
Confirm with other technical indicators
Many crypto traders combine candlestick patterns with other technical indicators, such as Moving Averages or Relative Strength Index (RSI) to improve their trading strategies. When multiple indicators align, you gain more confidence in your trade decision.

Conclusion
While candlestick patterns can provide valuable insights, they’re not foolproof indicators, and trading always carries risks. It's essential that you use candlestick patterns in conjunction with other forms of analysis, have a risk management strategy, and continually adapt your approach based on market conditions.
If you want to make your trading experience easier, you can rely on automated trading bots and algorithms that are programmed to recognize and act upon specific candlestick patterns. Altrady offers you all of these and more! You can scan and analyze multiple cryptocurrency markets simultaneously and execute trades based on your criteria. Also, you get a powerful portfolio asset manager, so you can keep track of all your crypto assets, and automate all your trading strategy using the Smart Trading feature.