One of the most reliable clues for breakout-hungry traders is the ascending triangle. Whether you’re scalping altcoins or swing trading Bitcoin, understanding this pattern can give you a serious edge.
Let’s break it down: what the ascending triangle is, how to spot it, what it tells you, and how to trade it like a pro.
What Is the Ascending Triangle?
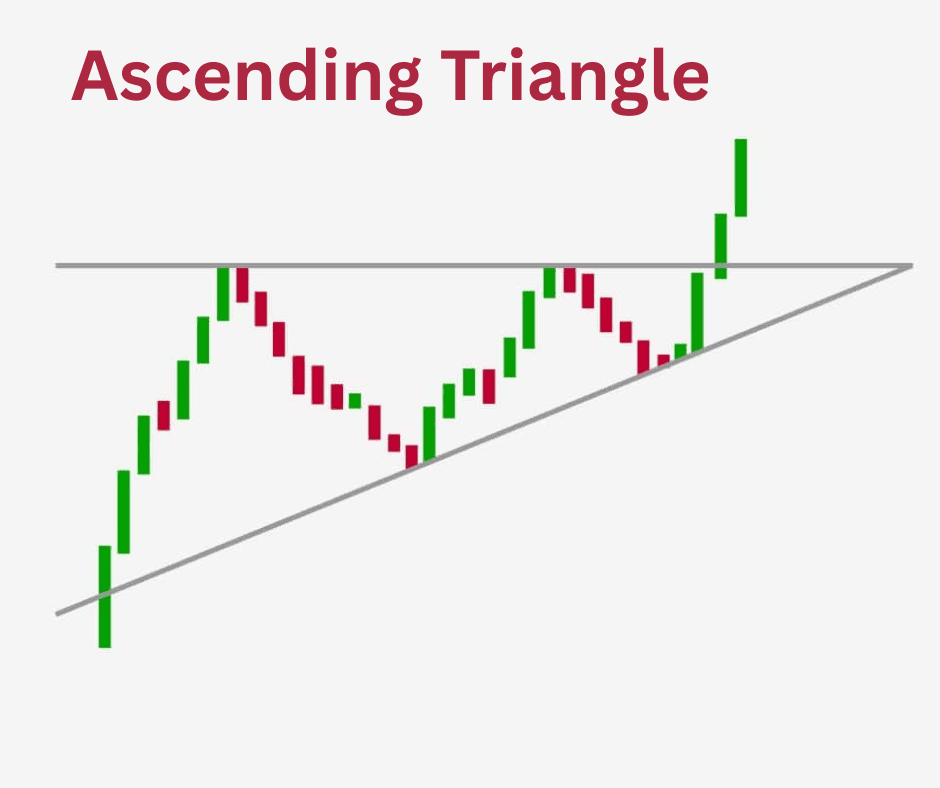
The ascending triangle is a bullish continuation pattern that typically forms during an uptrend. It’s like the market is coiling up, building pressure, and waiting to explode upward.
Picture this: price keeps hitting a horizontal resistance level, but the lows are getting higher. Buyers are stepping in earlier and earlier, showing strength. Eventually, the resistance gives way, and boom, the breakout.
This pattern reflects a tug-of-war between buyers and sellers. Sellers are defending a key level, but buyers are gaining ground. When the buyers win, price often surges.
How to Identify the Ascending Triangle
Spotting an ascending triangle isn’t rocket science, but it does require a trained eye. Here’s what to look for:
1. Flat Resistance Line
Price hits a ceiling multiple times at roughly the same level.
This horizontal line is the “top” of the triangle.
It shows where sellers are consistently stepping in.
2. Rising Support Line
Each dip gets bought up at a higher price.
Connect these higher lows with a trend line.
This upward-sloping line forms the “bottom” of the triangle.
3. Converging Lines
The resistance and support lines converge, forming a triangle.
The pattern typically develops over days or weeks, depending on your timeframe.
4. Volume Decline
Volume often decreases as the triangle forms.
This signals consolidation and a potential breakout buildup.
5. Breakout Point
The breakout usually happens when price closes above the resistance line.
Ideally, it’s accompanied by a spike in volume.
Pros and Cons of the Ascending Triangle Pattern
Like any tool in your trading arsenal, the ascending triangle has its strengths and weaknesses.
The Pros
- High Probability Setup: When confirmed, it often leads to strong breakouts.
- Clear Entry and Exit Points: The structure gives you obvious levels to trade around.
- Works Across Timeframes: Whether you’re day trading or swing trading, it’s versatile.
- Volume Confirmation: Volume helps validate the breakout, reducing false signals.
The Cons
- False Breakouts: Crypto is notorious for fakeouts. Price may briefly break resistance and then reverse.
- Subjectivity: Not all triangles are textbook-perfect. Drawing trend lines can be subjective.
- Requires Patience: The pattern can take time to form. Impatient traders may jump the gun.
How to Interpret the Ascending Triangle Pattern
So you’ve spotted an ascending triangle—now what?
1. Watch the Resistance Level
This is the key battleground. If price keeps testing it, that’s a sign of building pressure. The more touches, the stronger the breakout potential.
2. Monitor Volume
Volume should decline during the formation and spike on the breakout. No volume? Be cautious because it could be a trap.
3. Breakout Confirmation
Wait for a candle close above resistance, ideally with volume. Some traders use a percentage rule (e.g., 3% above resistance) to confirm.
4. Measure the Target
Take the height of the triangle (from the first low to resistance) and project it upward from the breakout point. That’s your price target.
5. Set Stop-Loss
Place your stop below the last swing low or below the support trendline. This protects you if the breakout fails.
Crypto Trading Strategies Using the Ascending Triangle
Let’s get tactical. Here are a few ways traders use ascending triangles in real-world crypto setups.
Strategy 1: Breakout Entry with Volume Confirmation
- Setup: Wait for price to break above resistance with a volume spike.
- Entry: Buy on the breakout candle close.
- Stop-Loss: Below the last higher low.
- Target: Measure the triangle height and project upward.
This is the classic approach. It’s clean, simple, and effective, especially in trending markets.
Strategy 2: Anticipatory Entry Near Support
- Setup: Identify the triangle early.
- Entry: Buy near the rising support line.
- Stop-Loss: Just below support.
- Target: Resistance level or breakout projection.
This strategy is riskier but offers better reward-to-risk. You’re betting the pattern will complete and break out.
Strategy 3: Retest Entry After Breakout
- Setup: Price breaks resistance, then pulls back to retest it.
- Entry: Buy on the retest bounce.
- Stop-Loss: Below the retest low.
- Target: Same as breakout projection.
This is a safer play for cautious traders. It avoids chasing the breakout and confirms strength.
Strategy 4: Shorting Failed Breakouts
- Setup: Price breaks resistance but quickly reverses.
- Entry: Short on the breakdown back into the triangle.
- Stop-Loss: Above the failed breakout high.
- Target: Triangle support or lower.
This contrarian strategy is for advanced traders. It requires quick decision-making and solid risk management.
Real-World Example: Ascending Triangle on Ethereum
Let’s say ETH is trading around $1,800. It’s hit resistance at $1,850 three times, but each dip gets bought at higher prices—$1,720, $1,750, $1,780.
You draw your triangle. Volume is declining. Then, ETH closes above $1,850 with a surge in volume. You enter at $1,860, set your stop at $1,780, and project a target of $1,920 based on the triangle height.
ETH hits $1,925 two days later. Trade complete.
Final Thoughts
The ascending triangle is one of the most powerful patterns in crypto trading—when used correctly. It’s not a magic bullet, but it gives you structure, clarity, and a tactical edge in volatile markets.
The key is discipline. Don’t chase breakouts without confirmation. Don’t ignore volume. And always manage risk.
Crypto rewards the prepared. So next time you see price coiling under resistance with rising support, pay attention. That triangle might just be your next big move.