One of the most common chart patterns, and arguably most important, is the symmetrical triangle pattern.
If you trade crypto and you’re not familiar with this one yet, it’s time to fix that. This pattern shows up all the time, it works across timeframes, and it can signal big moves when it breaks.
Let’s break down what it is, how to spot it, and how you can actually trade it without getting wrecked.
What Is the Symmetrical Triangle?
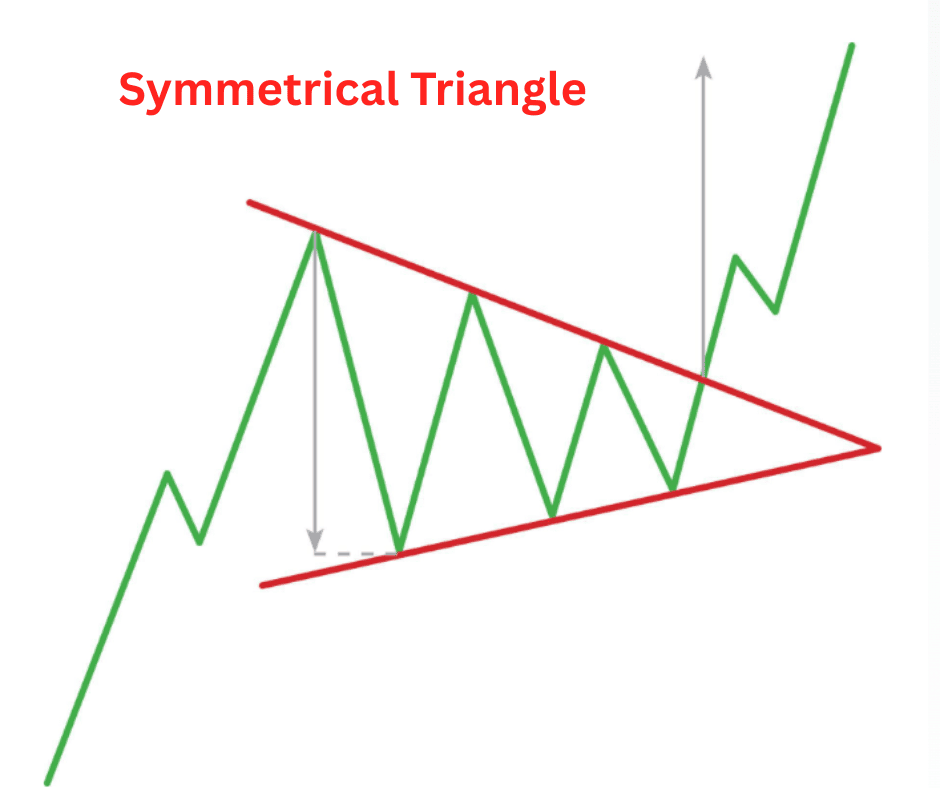
The symmetrical triangle is exactly what it sounds like: a triangle-shaped price formation on the chart. It happens when a crypto’s price is squeezed between two converging trendlines: one sloping down, one sloping up, until the two lines eventually meet.
In simple terms, it’s a period of consolidation where the market is undecided. Buyers and sellers are battling it out, each making weaker pushes than before. That’s why the highs keep getting lower and the lows keep getting higher. The tug-of-war tightens, the triangle narrows, and eventually, something’s gotta give.
And that “something” is usually a breakout, either up or down.
How to Identify the Symmetrical Triangle
Spotting a symmetrical triangle isn’t rocket science, but you do need to know what to look for:
Two converging trendlines
- The upper line slopes down, connecting a series of lower highs.
- The lower line slopes up, connecting a series of higher lows.
Both lines are roughly symmetrical, giving that triangular look.
At least two touches on each side
You need at least two swing highs and two swing lows to draw proper trendlines.
More touches = stronger pattern.
Decreasing volume
Volume usually fades as the triangle forms. Traders step back while the market decides which way it’s going.
Breakout point
The breakout typically happens before the triangle closes completely — usually between the halfway and three-quarter mark of the pattern.
So when you see price bouncing between narrowing trendlines with shrinking volume, you’re likely looking at a symmetrical triangle.
Pros and Cons of the Symmetrical Triangle Pattern
Pros
- Common and reliable: It shows up often in crypto across all timeframes, from 5-minute charts to weekly candles.
- Clear breakout levels: The converging lines give obvious support and resistance levels.
- Potential for big moves: A clean breakout from a tight triangle can lead to explosive momentum.
Cons
- Neutral by default: Unlike patterns like ascending triangles (bullish) or descending triangles (bearish), symmetrical triangles don’t predict direction. Breakouts can go either way.
- False breakouts: Crypto loves to fake people out. Price might pop out of the triangle, only to whip back inside.
- Requires patience: The pattern can take time to form, which can be frustrating for traders looking for quick setups.
In other words, the symmetrical triangle is useful, but it’s not magic. You need confirmation and risk management to avoid getting chopped up.
How to Interpret the Symmetrical Triangle Pattern
Here’s the golden rule: the direction of the breakout is what matters.
Bullish breakout: If price breaks above the upper trendline with strong volume, it usually signals continuation of an uptrend or the start of a bullish move.
Bearish breakout: If price breaks below the lower trendline with strong volume, it often means continuation of a downtrend or the start of a bearish leg.
Measuring the Move
One of the most practical tricks: measure the widest part of the triangle (the “base”), and then project that distance from the breakout point. That gives you a rough target for how far the breakout could run.
Example: If the triangle base is $1,000 wide (say from $20,000 down to $19,000 on BTC), and BTC breaks upward at $19,800, then your target would be roughly $20,800.
Crypto Trading Strategies Using the Symmetrical Triangle
Now let’s talk practical application. How do you actually trade these things?
1. The Classic Breakout Trade
This is the most straightforward strategy.
Wait for price to clearly break the triangle with a strong candle close outside the trendline.
Confirm with rising volume (this is key — volume makes or breaks the signal).
Enter in the direction of the breakout.
Place your stop just inside the opposite side of the triangle.
Set your target using the “measure the base” method.
Example: ETH is consolidating in a symmetrical triangle. Price breaks above the top line with a surge in volume. You go long, place your stop just below the lower trendline, and target a move equal to the triangle’s height.
2. The Retest Strategy
Sometimes, price breaks out, then comes back to retest the broken trendline before moving further. This gives you a second chance to get in.
Wait for the breakout: Don’t chase. Instead, watch for price to pull back and test the broken line as support (in a bullish breakout) or resistance (in a bearish breakout).
Enter after confirmation of the retest: This strategy often has a tighter stop and better risk-reward, but you may miss the move if price runs without looking back.
3. The Fakeout Play
Remember, crypto is notorious for fakeouts. Some traders actually trade against the initial breakout if they spot weakness.
If price breaks out but volume is weak, and price quickly re-enters the triangle, that’s a red flag.
Aggressive traders will short a failed upside breakout or go long after a failed downside breakout.
This is more advanced and risky, but in volatile crypto markets, fakeouts happen a lot.
4. Multi-Timeframe Confirmation
One way to improve your odds is to check symmetrical triangles on multiple timeframes.
A breakout on the 4H chart that aligns with a bullish trend on the daily chart carries more weight.
If a breakout on the 15-min chart goes against the daily trend, be cautious.
5. Combine With Indicators
Don’t just rely on the triangle itself. Use supporting indicators:
- RSI: Look for divergence that hints at momentum behind the breakout.
- Moving Averages: Check if the breakout lines up with key MA support/resistance.
- Volume Profile: See if the breakout is happening near high-volume nodes.
Real-World Examples in Crypto
Bitcoin (BTC): BTC has printed symmetrical triangles at key points in its history. For example, before the massive breakout in late 2020 that took it to $40k, BTC spent weeks consolidating in a symmetrical triangle on the daily chart. The breakout was explosive and clean.
Ethereum (ETH): ETH often forms symmetrical triangles during strong trends. In bull runs, ETH’s symmetrical triangles usually break upward, offering continuation trades.
Altcoins: Smaller-cap coins are even more likely to form triangles because of thinner liquidity. The breakouts can be huge — but so can the fakeouts. Always manage risk tightly with alts.
Key Takeaways
The symmetrical triangle pattern is one of those bread-and-butter setups every crypto trader should have in their toolkit. It’s not flashy, it doesn’t promise guaranteed wins, but it’s reliable when used properly.
Here’s the quick recap:
- It’s a neutral consolidation pattern with converging trend lines.
- The breakout direction decides the move.
- Volume is the key confirmation.
- Targets are measured from the base of the triangle.
- Combine it with other tools to improve your edge.
At the end of the day, trading symmetrical triangles is about patience and discipline. Wait for the setup to form, don’t jump in too early, and always use a stop loss. Crypto is volatile, and triangles can break in either direction; so, trade what you see, not what you hope for.