Flags, triangles, pennants, traders love giving names to these repeating formations. One of the most talked about, and often misunderstood, is the rising wedge pattern.
It’s one of those setups that can make or break a trade, depending on whether you spot it early and know what to do with it. In this guide, we’ll break down exactly what the rising wedge is, how to identify it, the pros and cons, how to read it, and even some strategies to trade it in crypto markets.
What Is the Rising Wedge?
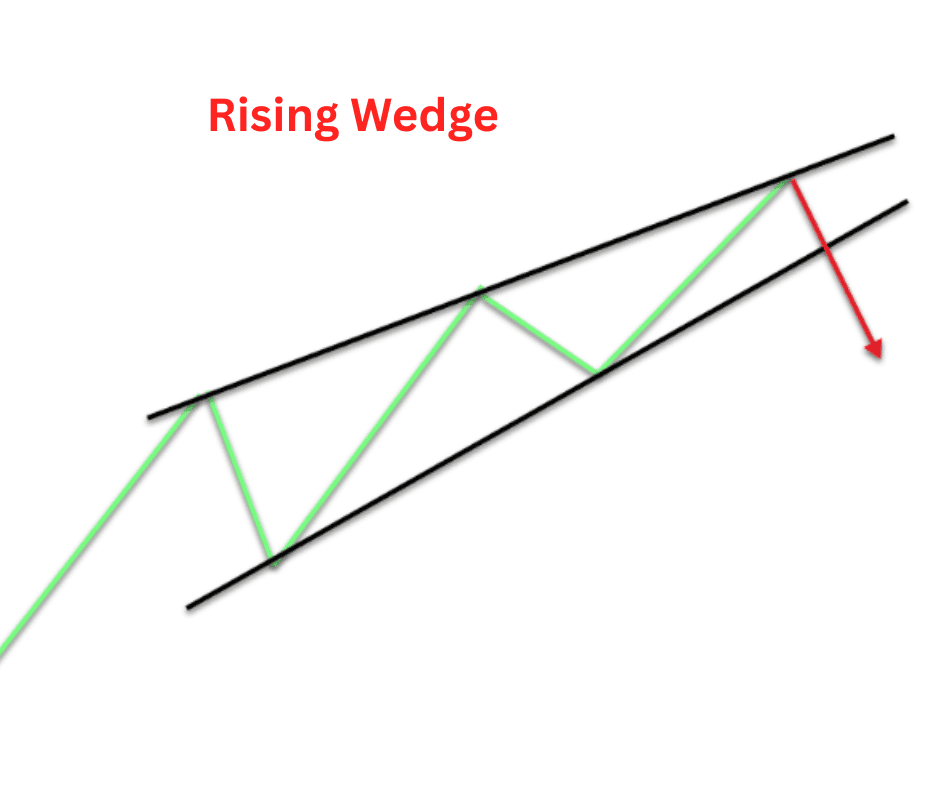
A rising wedge is a chart pattern that forms when the price is climbing but doing so inside a narrowing channel. Both the highs and the lows are going up, but the lows are rising faster than the highs. This creates a wedge-like shape that’s slanting upwards.
On paper, that might sound bullish (after all, the price is going up). But here’s the catch: the rising wedge is often a bearish reversal pattern. That means even though the price is climbing, the momentum is usually running out of steam. Once the wedge breaks down, the market tends to move sharply lower.
In other words: rising wedge = warning sign.
In crypto, where price swings are already exaggerated, this setup can act like an early alarm bell before a nasty sell-off.
How to Identify the Rising Wedge
Spotting a rising wedge isn’t just about drawing lines on a chart. You need to look at the bigger picture and check a few boxes. Here’s what makes up a proper rising wedge:
1. Trend Direction Before the Pattern
The rising wedge usually forms after a strong bullish move. Think of it like the market sprinting hard, then gradually slowing down as it runs out of energy. If you see one forming after a pump, pay attention.
2. Two Converging Trendlines
This is the visual heart of the wedge:
The support line (bottom) slopes upward.
The resistance line (top) also slopes upward, but at a shallower angle.
As price bounces between these two lines, the channel keeps getting tighter.
3. Volume Confirmation
Volume often fades during a rising wedge. The excitement that pushed the market up in the first place is drying up. Lower trading activity signals weaker conviction behind the upward moves.
4. The Breakout Point
The real action happens when the price finally breaks below the lower trend line. That’s when the wedge confirms as bearish. In many cases, this breakdown is fast and sharp.
Pros and Cons of the Rising Wedge Pattern
Like any trading tool, the rising wedge comes with strengths and weaknesses. Knowing both helps you avoid common traps.
Pros
- Early warning system: It’s one of the few patterns that can tip you off before a reversal, giving you time to plan.
- Clear structure: The converging lines make it easy to spot once you know what you’re looking for.
- Works across time frames: You can find rising wedges on 1-hour charts, daily charts, or even weekly charts.
Cons
- False signals: Not every wedge breaks down. Sometimes the price keeps grinding higher and invalidates the setup.
- Hard to time: Knowing when the wedge will break is tricky. Get in too early and you might get stopped out.
- Subjectivity: Different traders might draw the trend lines slightly differently, leading to mixed interpretations.
How to Interpret the Rising Wedge Pattern
A rising wedge is like the market flashing yellow lights at an intersection: slow down, caution ahead. But how you act on it depends on context.
1. Bearish Reversal (Most Common)
When the wedge forms after a strong uptrend, the breakdown usually signals the end of that trend. This is the classic bearish setup: once the lower line cracks, sellers often take over, pushing price lower.
2. Bearish Continuation
Sometimes, a rising wedge can appear during a downtrend as a “pause” before the next leg down. In that case, the wedge is basically a counter-trend rally that fizzles out before the market continues dropping.
3. Invalidation
If the price breaks above the upper trend line instead of down, the wedge fails. This usually means strong bullish momentum is still in play. In crypto, invalidations happen more often than in traditional markets, so risk management is non-negotiable.
Crypto Trading Strategies Using the Rising Wedge
Alright, let’s talk tactics. Knowing what a rising wedge looks like is one thing. Actually trading it is another. Here are some practical strategies traders use:
1. Shorting the Breakdown
The most straightforward approach:
- Wait for the price to close below the lower trendline.
- Enter a short position on confirmation.
- Place your stop loss just above the most recent swing high inside the wedge.
- Target the previous support level or use measured move analysis (the height of the wedge projected downward).
This works especially well in highly liquid coins like BTC and ETH, where the breakdowns are sharper.
2. Using It as a Take-Profit Signal
Even if you’re not into shorting, a rising wedge can serve as an early “exit alert” for longs. If you bought during the uptrend, seeing a wedge form could be your cue to lock in profits before the rug gets pulled.
3. Combine With Indicators
On its own, a rising wedge can be noisy. Pairing it with indicators like RSI or MACD adds extra confirmation.
- If RSI is showing bearish divergence (price rising but RSI falling), the wedge is more likely to break down.
- If MACD crosses bearish during the wedge, that’s another red flag.
4. Multi-Timeframe Confirmation
Check higher time frames. A wedge forming on the 4-hour chart might look insignificant. But if you zoom out to the daily and see the same pattern aligning with major resistance, the setup carries more weight.
5. Scalp Opportunities Inside the Wedge
Advanced traders sometimes scalp the price swings inside the wedge, buying support and selling resistance. This is risky (since wedges are prone to sudden breakdowns), but it can be profitable if managed tightly.
Examples in Crypto Markets
Let’s ground this with some crypto-specific context.
Bitcoin (BTC): Rising wedges often appear after BTC rallies hard. For example, during bull runs, you’ll see mini rising wedges form near local tops. When they break down, they often trigger corrections of 10–20%.
Altcoins: Because alts are more volatile, rising wedges in coins like SOL, ADA, or MATIC tend to play out even more dramatically. Breakdowns can lead to sharp drops of 30% or more.
Bear Market Rallies: In 2022, many altcoins formed rising wedges during short-lived rallies. Traders who spotted them avoided holding bags as the market resumed its downtrend.
Key Takeaways
The rising wedge isn’t a crystal ball, but it’s a powerful tool when used with context and discipline. It reminds traders that even when prices are rising, not all uptrends are healthy.
What you need to remember:
- Learn to spot the converging trendlines and fading volume.
- Don’t jump the gun—wait for confirmation.
- Use it in combination with other signals for stronger setups.
- Always, always manage your risk.
Crypto is wild, and no pattern guarantees profits. But if you train your eye for rising wedges, you’ll start spotting exhaustion in rallies before the crowd. And in this market, being early is half the game.