Crypto’s constant shake is exactly why price action traders keep hunting for patterns that hint at strong reversals. One of the cleanest, yet often overlooked, is the island reversal. It’s simple, visual, and when it appears on higher timeframes, it can mark explosive shifts in trend.
This article breaks it down in plain language so you can recognize it, understand what it means, and build strategies around it.
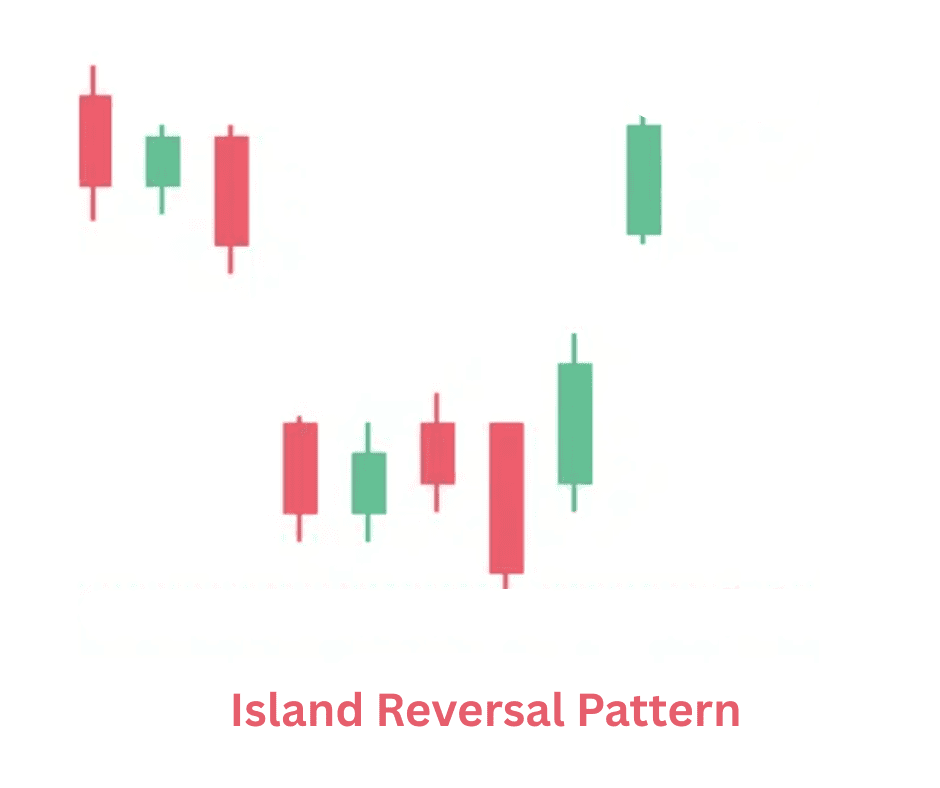
What Is the Island Reversal Pattern
An island reversal is a chart pattern that signals a strong shift in market sentiment. It happens when price gaps away from the trend, trades in a small isolated zone, then gaps back in the opposite direction. That isolated chunk of trading activity looks like a little island cut off from the rest of the chart, which is how the pattern gets its name.
In traditional markets, gaps are common. In crypto, price trades nonstop, so gaps mostly show up during extreme volatility or on smaller exchanges. Still, island reversals occur often enough on high volume assets and during fast moves that traders pay close attention to them.
At its core, the pattern highlights trapped traders. The market pushed in one direction with force, paused in a tight zone, and then reversed with just as much force, leaving anyone who bought or sold that “island” holding the bag. That trapped pressure often fuels the new trend.
How to Identify It
Even though markets move fast, this pattern is fairly easy to spot once you know what to look for. Here are the key components.
1. A Strong Prior Trend
An island reversal needs momentum. It appears after an aggressive move either up or down. That move sets the stage because traders are already leaning one direction.
2. A Gap in the Direction of the Trend
Price sharply gaps forward. It could happen after a news event, a liquidation cascade, or a liquidity sweep. In crypto, this gap may show up on low timeframes, during off-hours, or between candles on certain platforms. What matters is the sudden jump that leaves a void behind.
3. A Compact Trading Range
Once price gaps, it starts consolidating. The candles cluster together in a small zone. This cluster forms the “island”. The range is usually tight, which shows hesitation after the strong move.
4. A Second Gap in the Opposite Direction
This is the real reversal signal. Price gaps back across the island and reenters the previous zone. Anyone who entered during the island is immediately underwater.
5. A Follow Through Move
A valid island reversal does not stall after the second gap. It tends to push in the new direction with conviction.
If those five elements line up, you likely found an island reversal.
How It Looks on a Crypto Chart
Imagine Bitcoin pumps from 58,000 to 61,500 in one violent move. Then you see a small cluster of candles between 61,200 and 61,800. Out of nowhere, a sharp dump sends price straight back to 59,500 with a clean break from the cluster. That small area becomes the island. Buyers there are trapped and may panic exit, adding momentum to the downside.
Pros and Cons of the Island Reversal Pattern
Pros
1. Clear Visual Structure
Some reversal patterns get messy. Not this one. The clean gaps create a simple visual cue that stands out without fancy indicators.
2. Strong Sentiment Shift
Two gaps in opposite directions signal that the market sentiment flipped quickly. That shift often leads to sharp follow through.
3. Good Risk Management Opportunities
Because the island is compact, it gives you a clear invalidation point. A stop can sit just above or below the island range, depending on direction.
4. Works Well on High Time Frames
On higher timeframes like the four hour, twelve hour, or daily chart, the pattern becomes even stronger and more reliable.
Cons
1. Gaps in Crypto Are Less Common
Crypto trades nonstop, so clean textbook gaps may not appear often unless you look at specific exchanges or timeframes.
2. Liquidity Noise Can Trick You
Some fast wicks may look like gaps at first glance but do not qualify as a true island. In volatile markets, false positives happen.
3. Pattern Completes Fast
By the time you confirm the second gap, the best part of the move may be underway. Enter too late and you chase.
4. Works Best With Volume Confirmation
Without strong volume on the reversal gap, the pattern can fail quickly.
How to Interpret the Pattern
The island reversal represents a psychological trap. The first gap shows enthusiasm in the trend direction. The consolidation signals indecision. The second gap reveals a sudden power shift as new buyers or sellers jump in with force.
Here is how to read the situation.
1. The Island Shows Vulnerability
The market pauses after a strong move. That pause tells you momentum is losing steam.
2. The Opposite Gap Triggers Panic
The instant price gaps back, traders stuck inside the island react fast. They exit, flip, or get liquidated. That adds fuel to the new direction.
3. The Pattern Often Leads to Fast Moves
Since the exit pressure compounds, moves after an island reversal usually carry momentum. Many traders use this acceleration to ride short-term swings.
4. The Island Acts as a Key Supply or Demand Zone
Once price leaves the island behind, that area becomes a strong zone. If price returns to it, reactions often occur there.
Crypto Trading Strategies Using the Island Reversal Pattern
Strategy 1: Classic Reversal Entry
This is the most direct method, and here’s how it works:
Wait for the second gap to form. As soon as price pulls back slightly after that gap, you enter in the new direction.
- Entry: After the second gap, during the first small pullback.
- Stop: Above the top of the island for bearish reversals or below the bottom for bullish ones.
- Targets: Prior support or resistance levels, or measured move targets based on volatility.
Why it works
The second gap confirms the shift. You are not guessing. You enter as trapped traders begin to unwind their positions.
Strategy 2: Retest of the Island Edge
Sometimes price will gap away, move with force, then retest near the edge of the island cluster. This gives you a better entry with tighter risk.
How it works
Let the reversal play out. When price pulls back and taps the island’s boundary, enter.
- Entry: On retest of the island edge.
- Stop: Inside the island range.
- Targets: Trend continuation targets or volume based levels.
Why it works
The retest confirms that the island now acts as a supply or demand zone. It also allows for a high reward to risk setup.
Strategy 3: Combine With Volume Spikes
Volume adds weight to this pattern, so watch for a volume spike on the second gap. Enter only when both price and volume confirm the reversal.
- Entry: After a strong volume candle appears on the reversal gap.
- Stop: Beyond the island.
- Targets: Major support or resistance zones.
Why it works
Volume shows real participation, not just noise. It helps filter out weak or fake reversals.
Strategy 4: Multi-Time Frame Alignment
Island reversals that appear on high time frames but are traded using low time frame confirmations can lead to precise entries.
How it works
Check the 4-hour or daily chart for an island. When you find one, drop to a lower timeframe like the 15-minute or 5-minute chart and wait for a clean structure shift, such as a break of market structure or a micro retest.
- Entry: On the lower timeframe trigger.
- Stop: Based on the lower timeframe setup, not the entire island.
- Targets: Higher timeframe levels.
Why it works
You get the power of a higher timeframe reversal combined with the precision of lower timeframe entries.
Strategy 5: Island Reversal With Trend Filters
Some traders only take island reversals that align with a bigger market trend or macro structure.
How it works
Identify the long-term trend using moving averages or price structure. Only trade island reversals that push in the same direction.
- Entry: After confirmation that both the island reversal and the broader structure point the same way.
- Stop: Just beyond the island.
- Targets: Measured trend continuation levels.
Why it works
You avoid countertrend trades during dominant markets.
Bottom Line
The island reversal is one of the clearest signs of a sharp shift in momentum. While crypto doesn’t gap as much as traditional markets, the pattern still appears often enough on the right assets and timeframes to be useful. It helps identify trapped traders, builds structure for clean entries, and adds confidence to reversal setups.
Use it as a tool, not a prediction machine. Combine it with volume, support and resistance, and broader market context. When it hits, it hits hard, and it can give you some of the cleanest reversal plays in the crypto space.