Crypto trading often feels like a battlefield. Markets whip around, liquidity thins out at the worst moments, and sudden spikes can knock traders out of solid positions before the true move even begins. If you’ve ever been stopped out on a long just seconds before the price shot upward, you’ve probably met the shakeout. It’s a painful pattern when you are on the wrong side of it, but a powerful tool when you understand how it works.
Shakeouts happen in every market, but crypto is the perfect playground for them. With high volatility, aggressive liquidations, and traders chasing momentum, a shakeout can form quickly and catch a large chunk of the market off guard. Once you learn to recognize it, the pattern becomes more of an opportunity than a threat.
Find out what the shakeout pattern is, what it looks like, why it matters, and how you can use it to build smarter trading strategies.
What Is A Shakeout
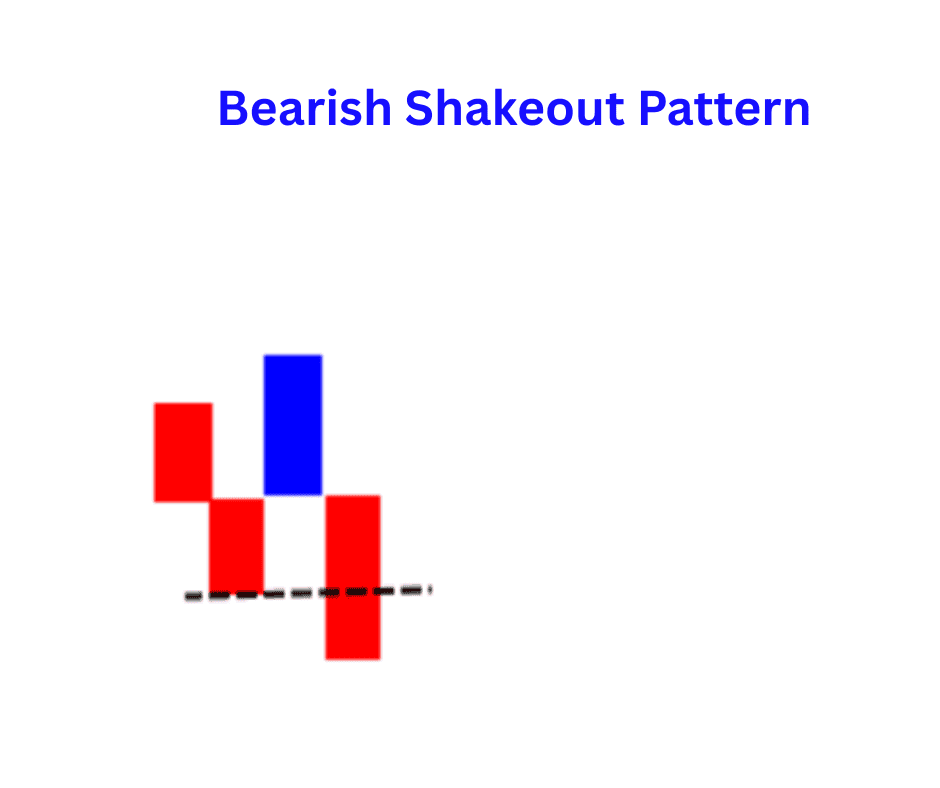
A shakeout is a manipulative-looking move where price quickly drops below a support level, triggers stop losses, scares out weak hands, and then snaps right back above the level with strength. It’s essentially a fake breakdown. The goal of the move, whether driven by large participants or market mechanics, is to force traders out of their positions before the real trend continues.
Imagine price hovering above a support level. Traders set stops just under that zone. Suddenly, the market dives, hits all the stops, triggers a wave of forced selling, and then shoots upward once the liquidity is cleared. That violent dip and recovery is the shakeout.
In crypto, shakeouts are common because of how many traders cluster stops in predictable zones and how easily large orders can sweep through thin liquidity pockets. Shakeouts also appear during accumulation phases when smart money wants to load up at better prices without attracting attention.
The pattern tells you one main thing: the market is removing weak holders so the real move can start.
How to Identify It
A shakeout has a distinct structure. Once you learn to spot the ingredients, it becomes easier to read what is happening under the surface. Here are the main components:
1. A clear support level
For a shakeout to work, price needs to threaten something obvious. The support level is usually a zone that traders have been watching. It could be horizontal support, the bottom of a range, a demand block, or a moving average cluster. The more obvious the level, the more effective the shakeout.
2. A sudden, fast breakdown through support
This is the heart of the pattern. Price slices below support with unusual speed. It often looks like the start of a real dump. Smaller traders panic. Bots fire stops. Liquidity thins out. The speed is what creates fear.
3. A swift recovery back above support
Right after the breakdown, price claws back to the support level and closes above it. This is the signal that the breakdown was a trap. Strong buyers show up. Volume often spikes. Momentum flips back upward as shorts get squeezed out.
4. Follow through in the direction of the original trend
If the shakeout succeeds, price usually continues upward from the support level. The market has taken liquidity, removed weak hands, and now has room to move.
Optional signals that strengthen a shakeout
- Volume spikes during the dip and again during the recovery
- Long lower wicks on higher timeframes
- RSI or MACD showing bullish divergence on the breakdown
- Liquidation clusters clearing below support before price bounces
- Multiple failed attempts to break down after the recovery
The cleaner the snapback, the more reliable the shakeout tends to be.
Pros and Cons of the Shakeout Pattern
Pros
1. Strong risk-to-reward potential
You buy near the point where the market has already cleared liquidity. Your stop can be tight, and upside can be big if the original trend resumes.
2. Works well in ranging or accumulating markets
Shakeouts are common when price is building a base. If you spot them, you often position yourself before the next major trend.
3. Helps you avoid getting liquidated at obvious levels
By learning how shakeouts behave, you stop placing your stops exactly where larger players expect them.
4. Combines naturally with volume, order flow, and liquidity analysis
Using heatmaps, liquidation charts, or spot volume can make shakeouts much easier to spot in crypto than in traditional markets.
Cons
1. Easy to mistake for a real breakdown
If you jump in too early, you risk catching a falling knife. Some breakdowns are real. Acting before confirmation can be expensive.
2. Shakeouts can be messy and unpredictable
The wick can be deeper than expected. The pattern doesn’t always form cleanly. Sometimes it happens too fast to trade live.
3. Requires strong discipline and patience
You often have to wait for the recovery before entering. Many traders get emotional and enter either too early or too late.
4. Works poorly in strong downtrends
If the overall market is bearish, a breakdown through support may not be a trap. It may be the start of a deeper selloff.
How to Interpret the Pattern
Understanding the psychology behind the shakeout is more important than memorizing its shape. This pattern tells you how different groups of traders behave at key moments.
Here is what a shakeout signals about the market:
- Buyers still want control: If price recovers fast, it means buyers saw value below support and stepped in aggressively.
- Weak hands were in the way: Many traders set stops in the same zone. Once those stops got hit, the market cleared out and could move without friction.
- The breakdown wasn’t real: If the market truly wanted to move lower, it would not snap back above support so easily. The quick rebound is a sign of strength.
- Smart money prefers favorable entry prices: Shakeouts often appear during accumulation phases. Larger participants want to pick up coins from emotional sellers at lower prices.
When reading a shakeout, always consider:
- Was the breakdown clean or sloppy?
- Was recovery fast or slow?
- Did volume confirm the move?
- Did price reclaim support and hold above it?
- Is the broader market structure bullish, neutral, or weak?
The pattern works best when the larger market context supports a bullish direction.
Examples of Crypto Trading Strategies Using the Shakeout Pattern
Now, let’s look at how traders use shakeouts in real trading environments. These strategies are practical, simple, and built around the behavior of crypto markets.
Strategy 1: The Reclaim Entry
This is the most popular way to trade a shakeout. Identify a key support level that has been tested multiple times.
- Wait for price to break below it.
- Do nothing during the breakdown.
- Enter only when price reclaims the support level with a strong close.
- Place a stop below the wick of the shakeout.
- Target range highs, recent swing highs, or major resistance.
This strategy avoids catching the falling knife and focuses on confirmation.
Strategy 2: Shakeout plus RSI Divergence
Momentum indicators often give early clues. As price breaks support, check the RSI on one or two timeframes.
If price makes a lower low while RSI makes a higher low, you have bullish divergence.
- Wait for price to reclaim support.
- Enter on the first strong green candle after the reclaim.
- Place a stop below the shakeout low.
This extra filter helps weed out breakdowns that are not real shakeouts.
Strategy 3: Liquidity Sweep Sniper Entry
This strategy focuses on how stops get cleared. Identify where traders are likely placing stop losses.
- Mark liquidity clusters below support.
- Wait for price to sweep those zones and print a long wick.
- Enter immediately after the wick closes and price begins reversing.
- Keep stops tight since liquidity sweeps often bounce fast.
This strategy is best for experienced traders who can react quickly.
Strategy 4: Multi-Time Frame Shakeout Confirmation
Shakeouts often start on lower timeframes and confirm on higher time frames.
- Watch for a fast breakdown on 5-minute or 15-minute charts.
- See if the 1-hour or 4-hour candle closes back above support.
- Use the higher timeframe reclaim as your entry trigger.
- Hold for a larger trend continuation move.
This is a calmer strategy for swing traders who hate noise.
Strategy 5: Range Trading with Shakeout Validation
Shakeouts commonly appear at the bottom of ranges.
- Mark your range high and range low.
- Wait for price to break below range low.
- If price reclaims range low fast, treat it as a shakeout.
- Enter long targeting the mid range or range high.
This works well in choppy markets where price moves sideways for weeks.
Final Thoughts
Shakeouts are part of the crypto landscape. They punish traders who place stops at predictable levels, and they reward traders who understand how the market hunts liquidity. While the pattern can feel brutal when you are caught in it, once you learn to recognize it, the shakeout becomes one of the most powerful bullish reversal setups in your trading toolkit.
The key is patience. You do not trade the breakdown. You trade the reclaim. The real signal is the strength of the recovery, not the drama of the dip.