When you’re knee-deep in the charts, spotting a diamond top can feel like catching a rare Pokémon: exciting, but also tricky if you don’t know what you’re looking at. This pattern doesn’t pop up every day, but when it does, it’s often a big flashing sign that momentum is shifting. For crypto traders who thrive on volatility, understanding the diamond top is a solid edge.
This guide breaks it all down: what the diamond top is, how to identify it, its pros and cons, how to interpret it, and a few strategies you can actually use when trading crypto.
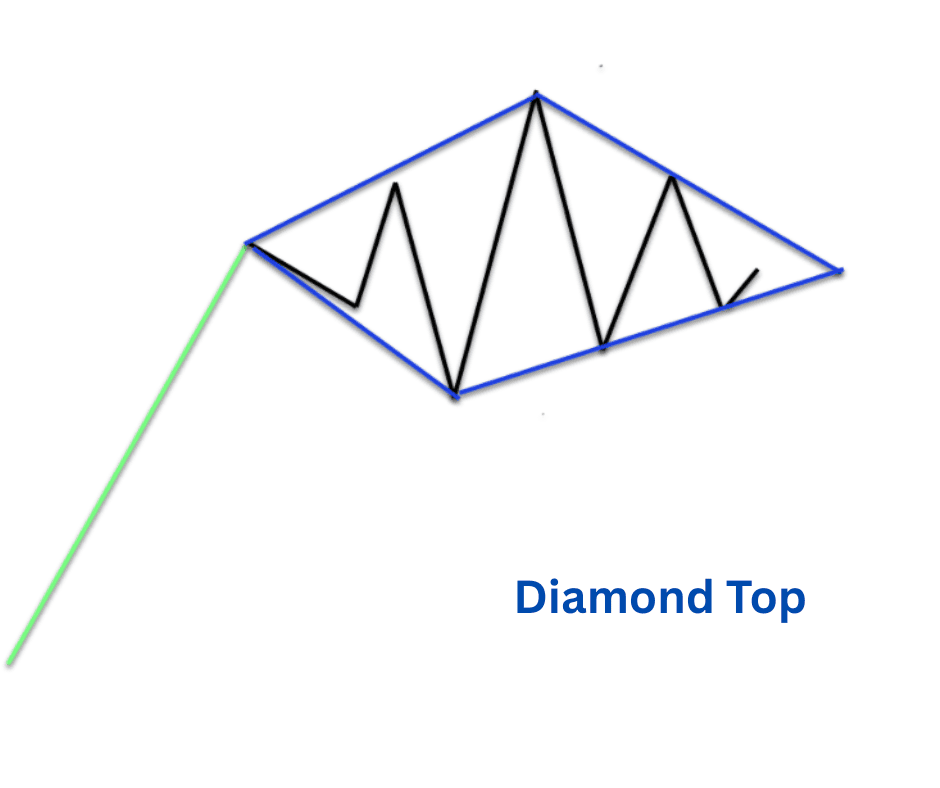
What Is the Diamond Top Pattern?
The diamond top is a bearish reversal pattern. In plain English, it shows up after a bullish run and usually signals that the price is about to roll over and head south.
On a chart, it looks like a stretched-out diamond sitting on its side. The price first expands outward, making wider swings, and then contracts inward, forming a narrowing shape. The result is a diamond-shaped structure at the top of an uptrend.
Think of it like this: bulls have been running the show, pushing price higher, but things start to get messy. Volatility widens as buyers and sellers wrestle. Eventually, buyers lose steam, sellers tighten the grip, and the breakout usually heads downward.
How to Identify It and Its Components
Spotting a diamond top takes some practice. Here’s what to look for:
1. The Context
The pattern forms after a solid uptrend. No uptrend? No diamond top.
Without context, it’s just random price noise.
2. The Broadening Phase (Left Side of the Diamond)
The price swings get wider: higher highs and lower lows.
Volatility expands: candles look longer, swings feel more chaotic.
This expansion creates the left edge of the diamond.
3. The Contracting Phase (Right Side of the Diamond)
After the chaos, the swings start shrinking.
Price makes lower highs and higher lows, moving into a tightening wedge.
This is the right edge of the diamond forming.
4. The Breakdown
Once the pattern completes, price often breaks below the lower support line.
This is the bearish signal: the diamond top is essentially saying, “The party’s over.”
Tip for crypto charts: The diamond top can be easier to spot on higher time frames (4H, daily) because noise on smaller time frames can make patterns look distorted.
Pros and Cons of the Diamond Top Pattern
Like any chart pattern, the diamond top isn’t a crystal ball. Let’s keep it real and weigh the good against the bad.
Pros
- Strong Reversal Signal – When it works, it often predicts a solid downtrend.
- Easy to Trade the Breakout – Once support is broken, entries are clear.
- Good Risk-to-Reward – Stop-loss goes just above the right edge of the diamond, while downside targets are usually much larger.
Cons
- Rarity – Diamond tops don’t appear often in crypto charts, which means fewer setups.
- Hard to Spot – Beginners confuse them with head-and-shoulders or wedges.
- False Breakouts – Crypto markets love to fake out traders before running the real move. Diamonds are no exception.
How to Interpret the Diamond Top
So, what is the market actually telling us when a diamond top shows up?
Exhaustion of Buyers
The wide swings on the left side show uncertainty. Buyers can’t push smoothly anymore; they’re overshooting, then undershooting.
Control Passing to Sellers
The contraction on the right side means sellers are gaining confidence. Buyers are running out of steam, and price is coiling up for a break.
The Breakout Direction
In traditional markets, diamond patterns can break either way. In crypto, they’re more commonly bearish because of the extreme volatility and the way parabolic runs usually end.
Volume Confirmation
A true diamond top usually has higher volume during the broadening phase, then decreasing volume as the price contracts. On the breakout, you want to see volume spike again; otherwise, it might just be a fake move.
Crypto Trading Strategies Using the Diamond Top
Here’s where it gets fun: how to actually trade this pattern in crypto.
1. The Classic Short Trade
Entry: Wait for price to close below the lower support line of the diamond.
Stop-Loss: Place it just above the last swing high inside the right edge.
Target: Use recent support zones or Fibonacci retracements to set targets.
Example: On BTC/USDT daily chart, price forms a diamond top after a rally. Breakdown happens at $30,000. Short entry there, stop at $31,000, target $27,000. Risk/reward looks solid.
2. Aggressive Pre-Breakout Short
Some traders short near the upper resistance of the contracting phase.
Riskier, but you get better entry and reward if the breakdown happens fast.
Needs tight stops and discipline, or you’ll get wrecked.
3. Confirmation + Retest Strategy
After the breakdown, price sometimes retests the broken support (now resistance).
That retest can be a perfect short entry with a tighter stop.
Great for traders who prefer waiting for confirmation instead of jumping in early.
4. Scalping the Fakeouts
Crypto is notorious for fake breakouts. Some traders flip the script:
If price breaks up out of a diamond top but volume is weak, they fade the move (short it), expecting it to collapse back inside and then break down properly.
High-risk, advanced tactic, but it’s a weapon in the arsenal.
A Quick Case Study: Bitcoin’s Diamond Top in 2021
A well-known example happened on Bitcoin’s daily chart in April 2021, right before the May crash.
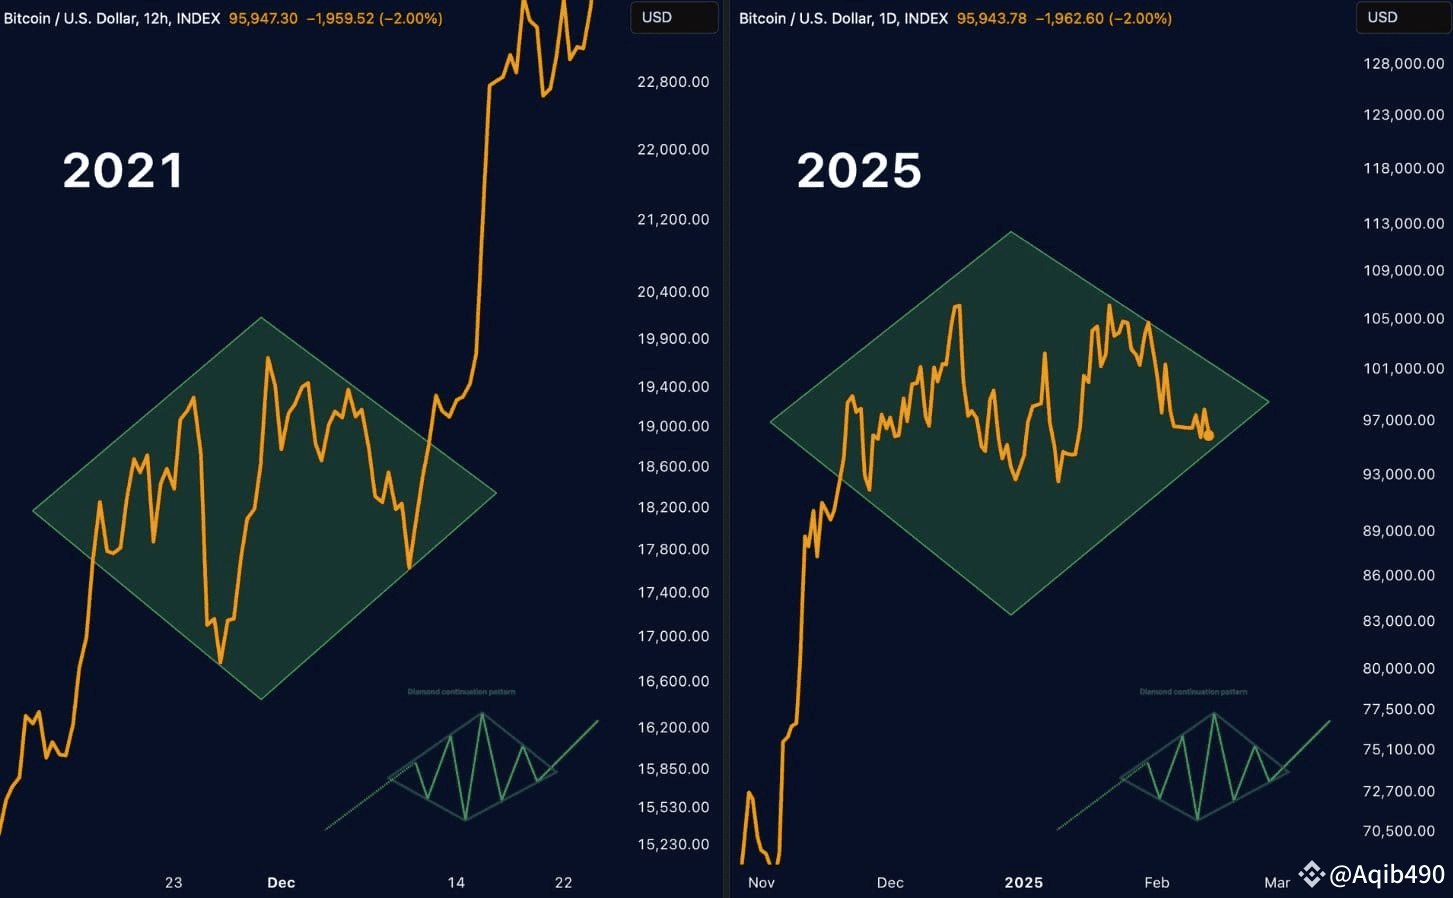
Source: Binance
BTC had been in a massive uptrend, pushing to $64,000.
Around the top, the price action expanded wildly, then contracted, forming a clear diamond top.
Once support broke, BTC dropped like a rock, eventually halving in value.
Traders who spotted that diamond had weeks of warning that the rally was cracking. Those who acted early could have shorted the breakdown or at least taken profit before the bloodbath.
Key Takeaways
The diamond top is a bearish reversal pattern that forms after a strong uptrend.
It has two phases: a broadening, chaotic swing (left side) and a tightening, coiling swing (right side).
- The breakdown below support is the key signal, ideally backed by strong volume.
- Pros: clear entries, solid risk/reward, strong reversal signal.
- Cons: rare, tricky to identify, prone to fakeouts.
- Strategies range from simple breakout shorts to advanced fakeout plays.
The diamond top is a tool worth adding to your pattern-playbook. It won’t make you rich overnight, but it can save you from bag-holding the top or better yet, let you profit when the hype finally burns out.