You might live by candlesticks, swear by indicators, or simply trust only your gut. But when you’re hunting for signs of a reversal, those golden moments when a beaten-down asset flips and starts climbing again, the pipe bottom pattern deserves your attention.
This isn’t one of those overhyped chart setups that show up once a decade. Pipe bottoms appear often enough to matter, especially in volatile markets like crypto, where sentiment can swing faster than a meme coin pump.
Find out more below about what a pipe bottom is, how to spot it, what makes it tick, and how you might trade it.
What Is the Pipe Bottom Pattern?
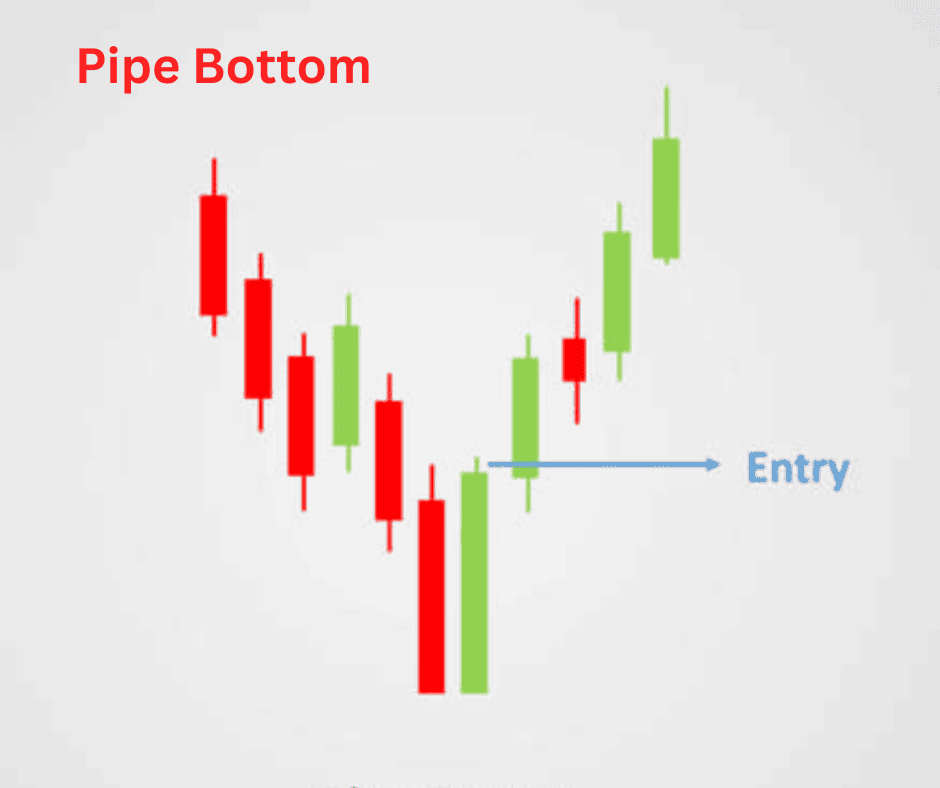
A pipe bottom is a bullish reversal chart pattern. It forms after a sharp downtrend, when price action suddenly bottoms out, builds a “pipe-like” structure with two tall candles, and then starts heading back up. Think of it as a panic-sell flush followed by a quick rebound.
The name comes from the way it looks on the chart: two long, almost identical candlesticks (usually with tall wicks or bodies) sitting side by side, resembling the shape of pipes sticking up from the floor. The first candle usually represents a heavy sell-off, while the second signals strong buying pressure snapping the market back up.
Traders love the pipe bottom because it hints that sellers may be exhausted and buyers are ready to step in. In other words, it’s one of those moments when the market says, “Enough is enough.”
How to Recognize It
Spotting a pipe bottom is fairly straightforward if you know what to look for. Here are the main components:
A Clear Downtrend
The pattern only matters after an extended decline. If price has already been chopping sideways, don’t mistake random candles for a reversal signal.
Two Tall Candles (the “Pipes”)
The first pipe: a long bearish candle, usually with a wide range. This shows capitulation – traders dumping their bags at any price.
The second pipe: a long bullish candle of roughly the same height, pushing back up toward the starting level of the first candle.
These two bars together look like twin towers, except one is red (bearish) and the other green (bullish).
Volume Confirmation
Ideally, the bearish flush comes with a spike in volume (panic selling), followed by equally strong or stronger volume on the rebound (buying strength).
Location
This pattern has more weight when it forms near a support zone, round number level (like $20,000 for BTC), or after extended oversold conditions on indicators like RSI.
Follow-Through
A pipe bottom is only legit if price actually starts trending upward afterward. If it stalls or breaks down again, it could be a fakeout.
Pros and Cons of the Pipe Bottom Pattern
Pros
- Easy to Spot: The two tall candles stand out clearly, even for beginners.
- Strong Reversal Signal: When confirmed, it often marks the exact bottom of a swing move.
- Works Well in Volatile Markets: Crypto’s tendency for sharp dumps and rebounds makes this pattern more frequent than in traditional markets.
- Good Risk-to-Reward Potential: If you buy near the second pipe, your stop can be set just under the low of the pattern, giving you a tight risk margin compared to potential upside.
Cons
- Not Foolproof: False signals are common, especially in thinly traded altcoins.
- Hard to Time Perfectly: Jumping in too early (during the first pipe) can get you wrecked. Waiting too long means missing the bounce.
- Dependent on Context: Works best in downtrends that are already stretched. If the dump is just starting, the “bottom” might not be real.
- Psychological Trap: Traders sometimes convince themselves they see pipes everywhere; that’s confirmation bias at work.
How to Interpret the Pipe Bottom
Understanding the psychology behind the pipe bottom makes it easier to trade with conviction.
- First Candle (Bearish Pipe): This is panic. Weak hands are capitulating, liquidations are firing, and it feels like the market is falling into a pit.
- Second Candle (Bullish Pipe): Smart money steps in. Buyers see value, shorts take profit, and fresh demand floods in, yanking price back up.
- The Message: Sellers have run out of ammo. Buyers are willing to defend this level. Momentum may be shifting.
But keep in mind that interpretation depends on context. A pipe bottom forming after Bitcoin has already crashed 40% in two weeks is very different from one appearing in the middle of a mild correction. The deeper the prior trend, the stronger the reversal potential.
Trading Strategies Using The Pipe Bottom
Here’s where theory meets practice. Let’s walk through some ways crypto traders actually use the pipe bottom in their setups.
1. Classic Entry and Stop-Loss
- Entry: Go long once the bullish second candle closes above the low of the first candle.
- Stop-loss: Place it just under the lowest wick of the two pipes.
- Target: Use nearby resistance zones or Fibonacci retracement levels to set profit targets.
This is the straightforward play: buy the reversal and manage risk tightly.
2. Volume-Backed Confirmation Strategy
A cautious approach is to wait for a strong volume spike on the bullish pipe. If the rebound candle has significantly higher volume than the dump, it suggests institutional or whale buying.
- Entry: After volume confirmation.
- Stop-loss: Below the pattern low.
- Target: Ride the move until momentum indicators (like RSI) show overbought levels.
3. Support + Pipe Combo
Pipe bottoms near major support zones (like long-term moving averages or psychological price levels) carry extra weight.
- Entry: Combine the pipe bottom with support confirmation.
- Stop-loss: Below both the support line and the pattern low.
- Target: Aim for the next resistance above the range.
Example: If Ethereum forms a pipe bottom at $1,000 (a key psychological level), and the bullish pipe comes with strong volume, that’s a powerful confluence.
4. Scaling In
Aggressive traders sometimes scale in during the second candle instead of waiting for a full close. This maximizes gains if the reversal sticks, but it also raises risk if it fails.
- Entry: Gradually buy as the second pipe builds momentum.
- Stop-loss: Same – below the low of the pattern.
- Target: Flexible – adjust based on how strong the rebound looks.
5. Swing Trading Pipe Bottoms
For swing traders, the pipe bottom is a perfect “swing low” setup.
- Entry: Enter on confirmation of the bullish pipe.
- Stop-loss: At the pattern low.
- Target: Multiple R-multiples (e.g., risk 1 to make 3), letting winners run if the trend flips bullish.
This approach is about catching the bigger move rather than scalping quick gains.
Real-World Example (Hypothetical Crypto Scenario)
Let’s imagine Bitcoin crashes from $28,000 to $24,000 in two brutal red candles. On the daily chart, a massive bearish bar prints with heavy liquidation volume. The next day, Bitcoin rebounds with a nearly equal-sized green candle, blasting back toward $26,500.
That’s a textbook pipe bottom. Traders who bought the close of the second candle around $26,000 could place a stop just below $24,000. If Bitcoin rallies back to $30,000 resistance, that’s a risk-reward ratio of 2:1 or better.
Final Thoughts
The pipe bottom pattern isn’t flashy or complicated, but that’s what makes it powerful. In crypto trading, where volatility punishes hesitation and rewards decisiveness, spotting a simple reversal signal can give you an edge.
That said, don’t treat it as gospel. Always check the bigger picture: trend context, volume, support levels, and market sentiment. Use it alongside other tools in your trading kit, not as a one-size-fits-all solution.
At its core, the pipe bottom tells a story of exhaustion and reversal. Sellers throw everything at the market, only to be met with overwhelming demand that flips the script. If you can read that story as it unfolds, you just might catch the next big bounce before the rest of the market wakes up.