When it comes to crypto charts, everyone sees something different. But every now and then, a pattern pops up that’s hard to ignore. One of those is the pipe top. It doesn’t get the same hype as head-and-shoulders or double tops, but make no mistake: this formation can mark the end of a bullish run and the start of some serious downside.
For instance, let’s say your favorite altcoin pumps like crazy, topping out with a sudden vertical spike. Traders are euphoric, Twitter(X) is buzzing, and everyone’s calling for higher highs. Then, almost out of nowhere, price slams back down just as fast as it went up. What’s left on the chart? A pipe-shaped double peak that signals buyers are exhausted.
That is the pipe top pattern, and if you know how to trade it, you can flip FOMO into opportunity.
What Is the Pipe Top Pattern?
The pipe top is a bearish reversal pattern that shows up after a strong uptrend. It’s basically the market saying, “That’s enough.”
Here’s the gist:
- Price rockets upward, often with big candles.
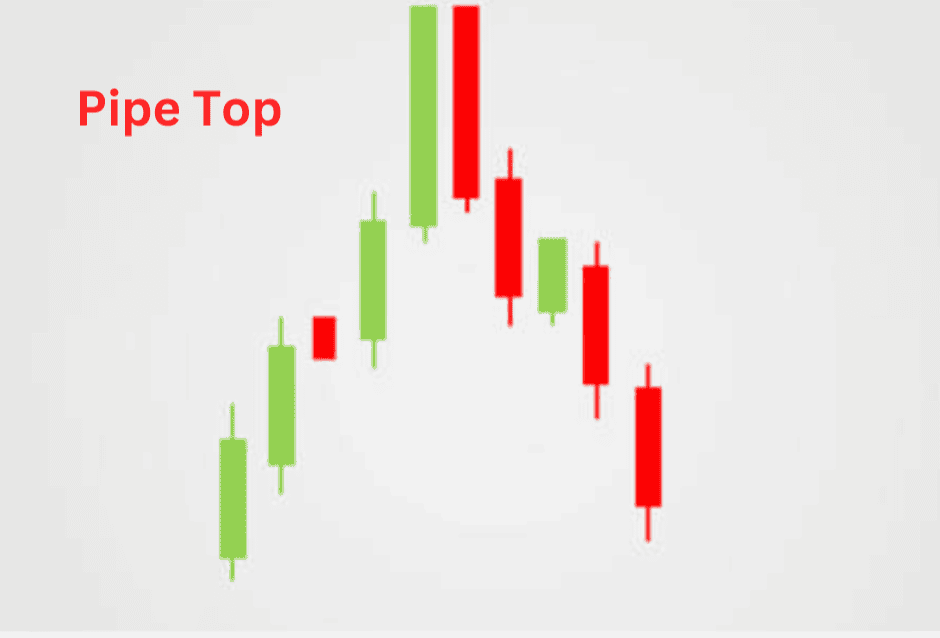
- It makes a sharp peak, sometimes two almost identical ones side by side.
- Then, instead of consolidating slowly, price reverses sharply, dropping like a stone.
The result on the chart looks like the end of a pipe: two thick vertical bars at the top (the price spikes) with a rounded or flat section between them. That’s where the name comes from.
Traders see it as a warning that the bullish trend has overheated, and bears are about to take the wheel. Unlike gradual topping formations, the pipe top tends to be fast and violent, which fits the crypto market’s personality perfectly.
How to Recognize It
Spotting a pipe top isn’t too complicated once you know the key elements. Let’s break it down:
A strong uptrend
The pattern doesn’t mean much unless it comes after a clear bullish run. If price has been drifting sideways, it’s not a pipe top; it’s just noise.
Two peaks (the “pipes”)
These are the dramatic price spikes that make the pattern stand out.
They usually form within a short time frame (days or even hours in crypto).
The highs are often very close in value, making it look like a twin peak.
Volume clues
Volume usually surges during the first spike as FOMO buyers pile in.
On the second spike, volume often fades, signaling exhaustion.
When the reversal hits, you’ll often see another burst of selling volume.
The breakdown
The final piece is the sharp move down. Once price breaks below the support level under the peaks, the reversal is confirmed.
Pros and Cons of the Pipe Top Pattern
Pros
- Easy to spot: The tall peaks are hard to miss, even for newer traders.
- Clear bearish signal: Once the pattern forms, it’s often followed by a decisive downtrend.
- Volume confirmation: Volume usually tells the story, making the setup more reliable.
- Fits crypto’s volatility: Because crypto loves sharp moves, the pipe top shows up fairly often.
Cons
- Fast-moving: The reversal can happen quickly, giving traders little time to react.
- False signals: Sometimes a pipe-like double peak just turns into sideways consolidation before another pump.
- Subjective shapes: Not every double spike is a textbook pipe top; interpretation can vary.
- Risk of FOMO: Traders chasing the second peak often get trapped, which can hurt if you’re late to shorting.
How to Interpret the Pipe Top
Once you’ve spotted a pipe top forming, the key is interpreting it correctly before jumping into trades.
Look at the context
Is the market already stretched after a long bullish run? The more overextended the rally, the more reliable the pipe top.
Watch the volume
High volume on the first peak, lower on the second, then a surge on the selloff = classic pipe top.
If volume keeps climbing on the second peak, be cautious; it might just be continuation.
Identify the support level
The floor right below the two peaks is critical. If price breaks it, the bearish move is confirmed.
Use confirmation, not prediction
Don’t guess. Let the breakdown happen first. Jumping in too early could mean shorting into a fakeout.
Set realistic targets
Measure the distance from the support line to the peak. That distance often mirrors the minimum move price makes after breaking down.
Trading Strategies Using The Pipe Top Pattern
1. The Classic Breakdown Short
- Setup: Identify the pipe top after the two peaks.
- Entry: Go short when price breaks below the support under the peaks.
- Stop-Loss: Place your stop just above the second peak.
- Target: Aim for a drop equal to the height of the pattern (peak to support).
This is the cleanest way to play it, with simple rules and low guesswork.
2. Retest Entry
Crypto markets love to retest broken support:
- Setup: Wait for the breakdown.
- Entry: Short on the retest of the old support (now resistance).
- Stop-Loss: Place stop just above the retest high.
- Target: Same measured move method applies.
This strategy can reduce the risk of false breakdowns.
3. Fade the Second Peak
Aggressive traders sometimes short near the second spike, betting that buyers will fail to push higher.
- Setup: Watch volume and momentum indicators (like RSI).
- Entry: Enter short if RSI is overbought and volume is weaker on the second peak.
- Stop-Loss: Place stop just above the second peak.
- Target: First target is the support under the peaks; second target is the measured move.
This requires experience, but it can give better risk and reward ratio since you enter before the breakdown.
4. Scalping Inside the Peaks
If the peaks form over several days, some traders scalp between them:
- Setup: Trade the mini-range between the first and second peaks.
- Entry/Exit: Buy dips, sell rips—short-lived trades.
- Risk: Sudden reversals can wipe out scalps fast, so tight stops are a must.
5. Long-Term Holder Adjustments
Even if you’re not shorting, recognizing a pipe top is valuable. If you’re holding bags, the pattern is a red flag to:
- Take profits before the breakdown.
- Hedge exposure with futures or options.
- Avoid adding new longs into exhaustion.
Real-World Example
Let’s walk through a hypothetical setup:
Ethereum pumps from $1,500 to $2,000 in just a few days.
On heavy volume, ETH spikes to $2,050, then pulls back slightly. Within 48 hours, it makes a second run, hitting $2,040—but this time, volume is noticeably weaker.
Shortly after, ETH breaks below $1,950 support. Using the pipe top target, traders measure the height ($2,050 – $1,950 = $100).
Price quickly drops to $1,850, hitting the measured target.
This kind of setup happens more often than you think in crypto, especially during overheated bull runs when coins climb too far, too fast.
Bottom Line
The pipe top might not be as famous as other patterns, but it’s one crypto traders should absolutely have in their toolbox. It’s simple, visual, and matches the “fast up, fast down” personality of this market.
Key takeaways:
- Look for pipe tops after strong uptrends, not in the middle of chop.
- Use volume as confirmation: weak buying on the second peak is a red flag.
- Don’t jump the gun. Wait for the breakdown or retest before risking your stack.
- Manage risk with clear stops, because crypto can fake you out hard.
At the end of the day, no pattern is a silver bullet. But the pipe top can help you spot when euphoria is turning into exhaustion—and in a market where timing is everything, that’s a powerful edge.