It’s one of the most talked-about formations among crypto traders is the descending triangle. The Descending Triangle pattern is simple enough to spot yet powerful enough to guide real trading decisions.
Find out more below: what the descending triangle is, how to identify it, its strengths and weaknesses, how to interpret it, and most importantly, how you can actually trade it in the crypto markets.
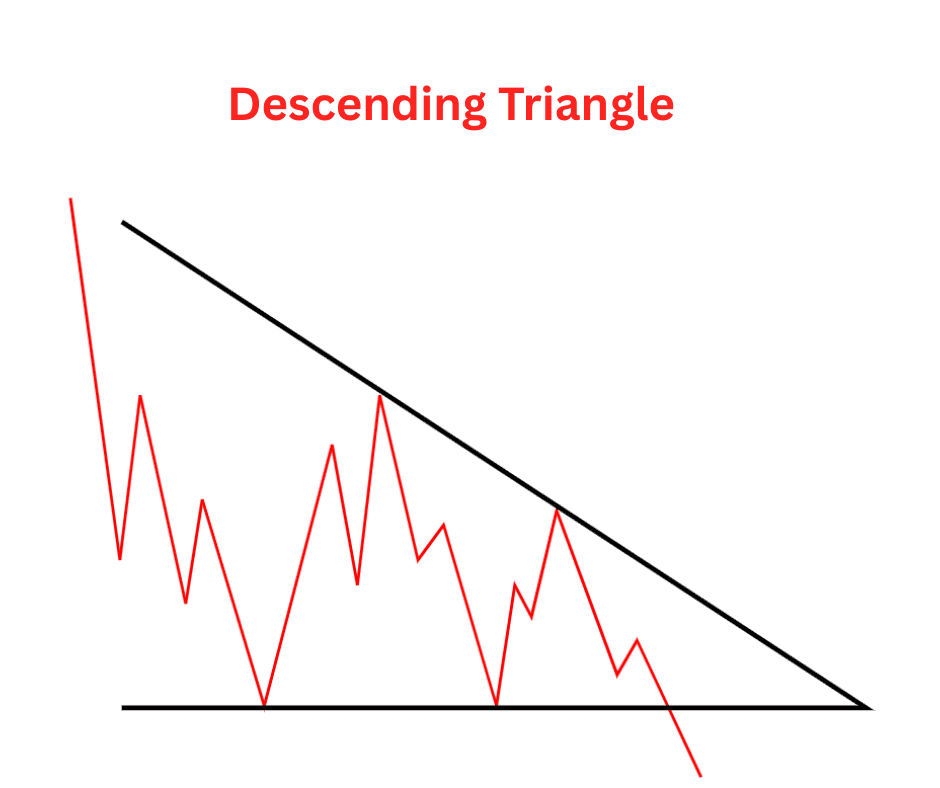
What Is the Descending Triangle?
The descending triangle is a bearish chart pattern that shows up when sellers are in control, but buyers are still putting up some fight. Picture a triangle lying flat on its base: the bottom side is a horizontal support line, while the top side slopes downward like a roof.
The psychology behind it is straightforward:
- Buyers are defending a certain price level (the support).
- Sellers keep stepping in earlier and earlier (lower highs), pressuring the price down.
Eventually, support tends to give way, and price breaks downward with momentum.
That’s why traders often use descending triangles to anticipate breakdowns. But as with all things in crypto, there are exceptions—and sometimes, they break upward instead. We’ll get into that later.
How to Identify the Descending Triangle
You don’t need to be a charting wizard to spot a descending triangle, but you do need to know what qualifies and what doesn’t. Here are the main parts:
The Horizontal Support Line
This is the floor price that the market keeps bouncing off. Think of it as the “line in the sand” where buyers say: “Not going lower than this.”
The more times price touches and respects this line, the stronger it is.
The Descending Resistance Line (Trendline of Lower Highs)
Drawn across the highs, this line slopes downward. Each peak is lower than the last, signaling sellers are growing more aggressive.
Volume Behavior
A proper descending triangle usually comes with declining trading volume. That’s the market coiling up, waiting for a breakout.
Breakout Point
The pattern completes when price decisively breaks below the support (most common) or occasionally above the descending resistance.
Checklist for spotting one:
- At least two swing highs forming the downward-sloping resistance.
- At least two lows hitting the same support level.
- Ideally, 4+ total touches between both lines to validate the triangle.
- Volume tapering off as the triangle progresses.
Pros and Cons of the Descending Triangle Pattern
Pros
- Easy to recognize: Unlike more complex formations (like head-and-shoulders), descending triangles are clean and beginner-friendly.
- Clear levels: The support line gives you a crystal-clear area to watch for breaks.
- Good risk management: You can place stop-losses just above resistance or above the breakout point.
- Versatility: Works across different timeframes—5-minute charts for scalpers, daily charts for swing traders.
Cons
- Not always bearish in crypto: Unlike traditional markets, crypto sometimes fakes you out with upside breakouts.
- False breakdowns: Price may dip below support briefly, trigger stops, then snap back up.
- Requires patience: The pattern can take days or even weeks to form, which is tough in fast-moving markets.
- Confirmation needed: Acting too early (before a real breakout) often leads to losses.
How to Interpret the Descending Triangle Pattern
Here’s how most traders read the pattern:
Bearish Expectation
The textbook outcome is a breakdown. Sellers have been tightening the noose, and buyers eventually give up. When support cracks, the move can be sharp.
The Measured Move
To project a target, measure the widest part of the triangle (the “height”) and subtract it from the breakout point. That gives you a rough price objective.
Example:
- Resistance at $28,000
- Support at $25,000
- Height = $3,000
If breakdown happens at $25,000, target = $22,000.
The Surprise Breakout
Sometimes, crypto likes to mess with the crowd. The descending triangle breaks upward, trapping shorts and fueling a squeeze.
When this happens, the “measured move” logic still applies, but you add the height instead of subtracting it.
Volume Confirmation
Breakouts with strong volume are far more reliable than weak, low-volume breaks. Volume is your lie detector.
Crypto Trading Strategies Using the Descending Triangle
Now to the juicy part: how do you actually trade a descending triangle in crypto? Let’s look at a few strategies.
1. The Classic Breakdown Trade
Setup: Wait for price to close below the support level with a noticeable volume spike.
- Entry: Enter short (or sell spot holdings) once the breakdown candle closes.
- Stop-loss: Place just above the last lower high or slightly above the support line.
- Target: Use the measured move projection.
Example: If Bitcoin has been bouncing between $25k support and lower highs, and it breaks down with volume, short toward $22k.
This is the most common use case. The key is patience—wait for confirmation.
2. The Fakeout Catcher
Setup: Sometimes the price “wicks” below support but quickly recovers. If you see a long downside wick with strong recovery volume, that’s a fakeout.
- Entry: Go long once price climbs back inside the triangle.
- Stop-loss: Just below the fakeout wick.
- Target: The descending resistance line or even a full breakout to the upside.
Example: ETH breaks under $1,600 briefly, then surges back to $1,650 with heavy buying. Enter long and ride toward $1,800+.
This works because many traders panic-sell on the fake breakdown, fueling liquidity for a bounce.
3. The Upside Breakout Play
Setup: Rare but deadly. If price breaks above the descending resistance with high volume, it invalidates the bearish bias.
- Entry: Go long on the breakout candle close or retest of the resistance as new support.
- Stop-loss: Below the breakout level or last low.
- Target: Add the triangle’s height to the breakout level.
Example: A descending triangle forms during sideways Bitcoin action, but instead of dropping, BTC breaks out above resistance. That could trigger a $3,000+ move upward.
This is especially potent in bull markets, where buyers are relentless.
4. Scalping Within the Triangle
Setup: Before the breakout, price often bounces between support and resistance like a pinball.
- Entry: Buy at support, sell at resistance (or short at resistance).
- Stop-loss: Tight, just beyond the lines.
- Target: Opposite side of the triangle.
Example: On a 15-minute chart, a descending triangle forms. Price keeps oscillating between $19,800 (support) and the descending resistance. Scalpers can take multiple small trades before the final breakout.
This strategy is risky but profitable for short-term traders who thrive in chop.
Key Takeaways
The descending triangle is one of the most useful—and misunderstood—patterns in crypto trading. It signals building pressure, usually bearish, but with enough curveballs to keep you on your toes.
Here’s what to remember:
- Look for clean horizontal support and a descending resistance line.
- Don’t front-run the breakout. Wait for confirmation with volume.
- Use the triangle’s height to project targets.
- Stay open-minded—crypto is notorious for invalidating “textbook” patterns.
Like every tool in trading, the descending triangle isn’t magic. But combined with good risk management and awareness of market context, it can give you an edge. Next time you see one forming on Bitcoin, ETH, or your favorite altcoin, you’ll know exactly what’s going on and how to play it.