You’ve probably seen those odd-looking geometric shapes traders draw: triangles, M’s, W’s, and zigzags that seem like modern art. Those are harmonic patterns, and while they might look fancy, they’re actually a mathematical way to predict where price might go next. Harmonic trading is about spotting those recurring shapes and using Fibonacci ratios to forecast turning points.
When done right, harmonic patterns can help you catch reversals early, get cleaner entries, and set tight stop losses – all gold for a crypto trader trying to stay ahead of the chaos.
Read below to find out what these patterns are, how to spot them, their upsides and downsides, and how you can use them to sharpen your strategy.
What Is a Harmonic Pattern
At its core, a harmonic pattern is a geometric price formation that follows specific Fibonacci ratios. Think of it as a roadmap of crowd psychology drawn on your chart. Price moves in waves: pushes, pullbacks, corrections, and harmonic patterns use those waves to forecast the next likely move.
Unlike basic chart patterns like a head and shoulders or a double top, harmonics are all about precision. They don’t rely on vague shapes. Each leg of the pattern must match certain Fibonacci retracements and extensions. That’s what makes them powerful and tricky.
The logic is simple: markets move in cycles. Human behavior repeats. Fibonacci ratios capture that rhythm. When a harmonic pattern lines up with those ratios, it signals that the market might be ready to reverse or accelerate in a predictable way.
Some of the most common harmonic patterns include:
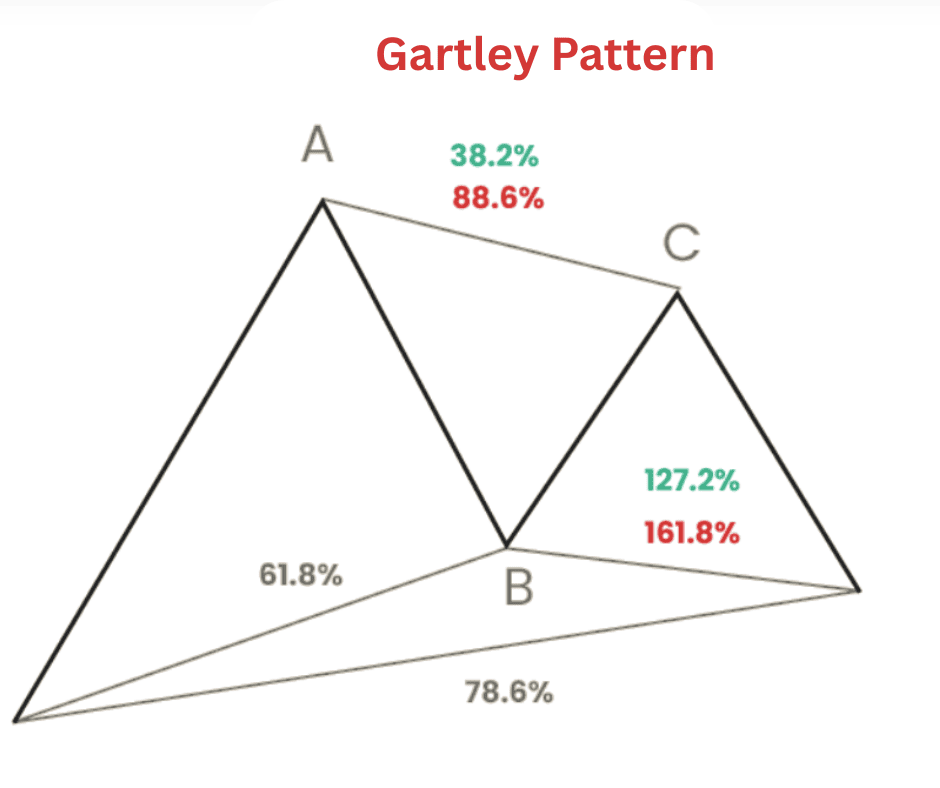
- Gartley pattern
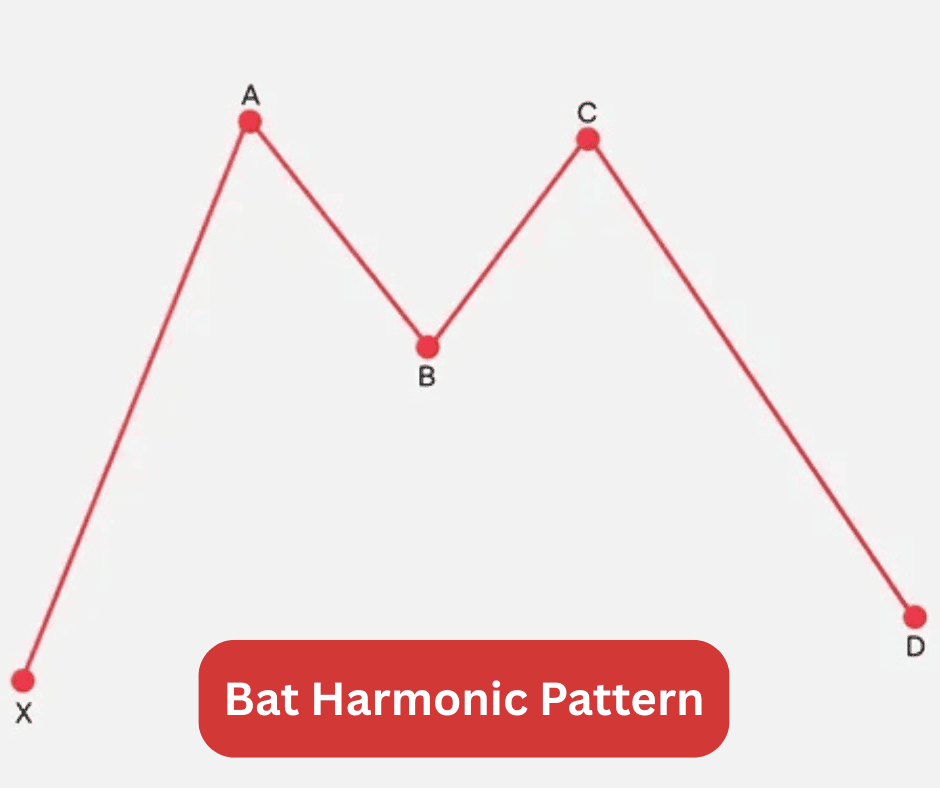
- Bat pattern
- Butterfly pattern
- Crab pattern
- Shark and Cypher patterns
Each has its own structure, ratios, and market behavior. But the core idea stays the same: the market moves in measured swings that echo past patterns.
How to Identify It
Every harmonic pattern is built from five key points labeled X, A, B, C, and D. The moves between them (XA, AB, BC, and CD) form the pattern’s legs.
Here’s the basic anatomy:
- XA – The initial impulse leg. Price makes a strong move either up or down.
- AB – A retracement of XA. Usually, it pulls back to a Fibonacci level like 0.618 or 0.786 of XA.
- BC – Another retracement, but this time it moves in the direction of XA again, forming the “zigzag.”
- CD – The final leg, and the one traders care about most. It’s where the pattern completes and where a potential reversal zone (PRZ) forms.
The PRZ is the sweet spot where multiple Fibonacci levels converge. That’s where you look for confirmation signals, like volume spikes, divergence, or candlestick patterns, to decide whether to enter the trade.
Example: The Gartley Pattern
Let’s use the Gartley (one of the OG patterns) as an example.
- AB retraces 61.8% of XA
- BC retraces between 38.2% and 88.6% of AB
- CD extends 127.2%–161.8% of BC
- D ends around the 78.6% retracement of XA
When all these align, you’ve got yourself a Gartley. The pattern looks like an “M” in a downtrend or a “W” in an uptrend. The potential reversal happens at point D.
Of course, identifying these patterns manually can be tedious, especially in volatile crypto markets where price moves fast. That’s why many traders use automated harmonic pattern scanners on platforms like TradingView or MetaTrader. But even then, you need to verify that the ratios make sense and the structure isn’t forced.
Pros and Cons of the Harmonic Pattern
Pros
-
High Precision
Harmonics aren’t based on guesswork. Every leg is defined by exact Fibonacci ratios, which brings structure and discipline to your analysis. -
Early Reversal Detection
You can often spot reversals before they’re obvious to everyone else. This gives you tighter entries and better reward-to-risk ratios. -
Works Across Time Frames
Whether you’re scalping on the 5-minute chart or swing trading on the daily, harmonic patterns appear on all timeframes. -
Fits Any Market
Forex, stocks, crypto, it doesn’t matter. Harmonic structures come from crowd behavior, and crowd behavior is universal.
Cons
-
Complex and Easy to Misread
Small errors in measuring Fibonacci levels can invalidate a pattern. Many “false” harmonics appear just because the ratios don’t quite fit. -
Lagging Confirmation
You usually wait for the pattern to complete before acting, which can mean missing part of the move. -
Subjectivity
Even with rules, traders sometimes force a pattern onto the chart. Confirmation bias can sneak in fast. -
Dependence on Fibonacci Accuracy
If your Fibonacci tools aren’t aligned or you pick the wrong swing points, the pattern’s entire logic falls apart.
The takeaway: harmonic patterns reward precision. If you’re a detail-oriented trader who enjoys structured analysis, they’ll fit you perfectly. If you prefer simple setups, you might find them too technical.
How to Interpret the Harmonic Patterns
Recognizing a pattern is one thing, but trading it smartly is another.
Step 1: Identify the Potential Pattern
Use Fibonacci retracements and extensions to outline possible XABCD structures as price moves. You’re not guessing; you’re waiting for the market to complete the pattern.
Step 2: Confirm the Ratios
Check the Fibonacci levels for each leg. The more precise they are, the stronger the pattern. For example, a Gartley that perfectly aligns with 61.8% and 78.6% retracements is more trustworthy than one that’s “close enough.”
Step 3: Watch for the PRZ (Potential Reversal Zone)
This is where the magic happens. The PRZ is a cluster of Fibonacci levels where the CD leg is expected to end. Watch how the price behaves here. Look for:
Those confirm that the pattern is respected and the reversal might hold.
Step 4: Plan the Entry and Exit
Enter near point D after confirmation. Your stop loss should go slightly beyond D, because if price blows past it, the pattern is invalidated. For take profit, many traders aim for:
- First target: 38.2% retracement of CD
- Second target: 61.8% retracement of CD
This keeps your trade logical and controlled, not emotional.
Trading Strategies Using This Pattern
Let’s make this real. Here are a few ways traders use harmonics to profit in the crypto space.
1. Spotting Bitcoin Reversals with the Butterfly Pattern
The Butterfly pattern often shows up at major tops or bottoms. Suppose Bitcoin’s been rallying hard, and you spot a Butterfly pattern forming near a key resistance. The pattern completes at a 127.2% or 161.8% extension of XA.
If you see exhaustion candles, lower volume, or RSI divergence at that point, you can short Bitcoin with a stop just above point D. As price retraces, scale out at Fibonacci targets.
This approach can help you catch major swings before everyone else notices the trend shift.
2. Using the Bat Pattern for Altcoin Pullbacks
The Bat pattern is great for buying dips in an uptrend. Say Ethereum is trending up, but it’s correcting. You notice a Bat pattern completing at the 88.6% retracement of XA.
That’s your potential buy zone. Wait for bullish confirmation (like a hammer candle or strong volume). Then go long with a stop slightly below point D.
The Bat’s tight structure often gives excellent reward-to-risk ratios because you’re entering close to where the pattern completes.
3. Combining Harmonics with Support and Resistance
Harmonics become more powerful when they align with horizontal support or resistance levels. If a pattern’s PRZ lands on a key level or previous price reaction zone, the odds of a successful reversal jump.
For example, if a Bearish Crab completes right at a major weekly resistance, that’s not just coincidence; it’s confluence. Smart traders love confluence.
4. Adding Volume and Momentum Filters
You don’t need to rely on geometry alone. Many traders use volume, RSI, or MACD to confirm the pattern. If you spot a Bullish Gartley and see RSI divergence plus increasing volume near D, that’s a strong entry setup.
Key Takeaways
Harmonic patterns are like a secret language of the market, one that blends math, psychology, and precision. They’re not for everyone, but for traders who appreciate structure and patience, they offer a clear framework for identifying reversals and setting disciplined trades.
In the fast, volatile world of crypto, that structure can be your edge. When Bitcoin spikes or altcoins dump without warning, harmonic traders don’t panic; they measure. They wait for the pattern to complete, confirm the ratios, and strike when the odds line up.
So next time you’re scanning charts and see those zigzag formations, don’t dismiss them as noise. They might just be the market’s way of whispering its next move.