Whether you’re trading Bitcoin, altcoins, or even meme tokens, spotting a falling wedge can give you an edge if you know how to use it.
Below you’ll find out everything you need to know about this pattern: what the falling wedge is, how to identify it, its strengths and weaknesses, and how to turn it into actionable trading strategies.
What Is the Falling Wedge Pattern?
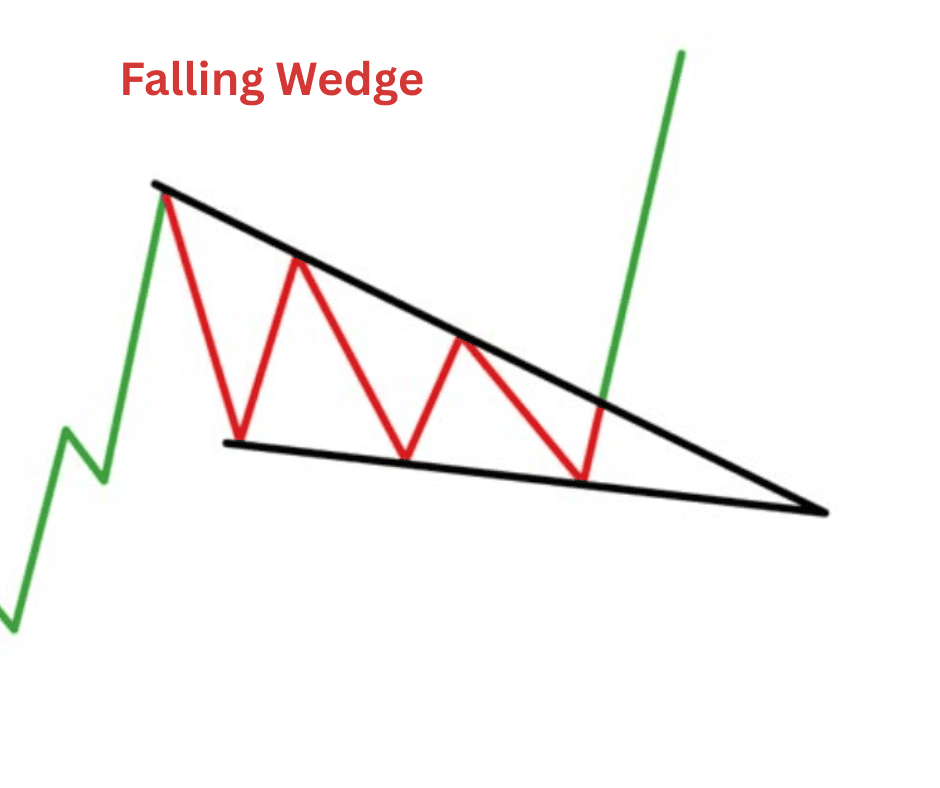
The falling wedge is a bullish chart pattern that signals a potential reversal or continuation in price action. It looks exactly like it sounds: two downward-sloping trend lines that converge toward each other, forming a wedge that points down.
Here’s the key: even though the price is moving lower while the wedge forms, the pattern often ends with a bullish breakout to the upside. Traders love it because it can flip bearish-looking conditions into strong upward moves.
There are two main scenarios where you’ll see a falling wedge:
- Reversal wedge: Forms during a downtrend, suggesting that the selling pressure is running out of steam and a bullish reversal might be around the corner.
- Continuation wedge: Forms during an uptrend, acting like a consolidation before the trend continues higher.
In crypto markets, this pattern can be a valuable tool for catching early signs of trend changes.
How to Identify the Falling Wedge
The falling wedge isn’t just any random set of candles pointing down. It has a few must-have features that make it legit:
1. Converging Trendlines
The upper trend line connects a series of lower highs.
The lower trend line connects a series of lower lows.
Both lines slope downward, but the top line is steeper, meaning sellers are losing steam.
2. Volume Decline
During the wedge, volume usually tapers off. That’s because the battle between buyers and sellers is shrinking. This decline in trading activity often foreshadows a big move once price breaks out.
3. Breakout Direction
The breakout almost always happens upward. The price pierces through the upper resistance trend line, usually accompanied by a noticeable spike in volume.
4. Time Frame
You can spot falling wedges on any time frame—from 5-minute charts to weekly ones. But as with most patterns, longer time frames (4H, daily, weekly) tend to carry more weight and reliability.
Quick Checklist to Confirm a Falling Wedge
- Price makes lower highs and lower lows.
- Trend lines converge toward each other.
- Volume decreases during formation.
- Breakout happens upward, ideally with higher volume.
Pros and Cons of the Falling Wedge Pattern
Pros
- Bullish edge: Historically, falling wedges resolve to the upside more often than not, making them a solid bullish setup.
- Early signals: They often appear before big trend reversals, giving traders a head start.
- Works across assets: Whether it’s BTC, ETH, or a smaller altcoin, the structure is universal.
- Clear entry/exit points: Breakouts above resistance provide obvious entry triggers, while the wedge’s lower boundary helps define risk.
Cons
- False breakouts: Crypto is notorious for fakeouts. Sometimes price pokes above the resistance line only to fall back inside the wedge.
- Subjectivity: Drawing trend lines can be an art. Two traders might see slightly different wedges.
- Not 100% reliable: No pattern is bulletproof. Even a textbook falling wedge can fail, especially in low-liquidity coins.
- Requires patience: The wedge can take a long time to develop, testing traders who want quick action.
How to Interpret the Falling Wedge
Spotting the wedge is step one. Step two is knowing how to interpret it in context.
Look at the preceding trend.
- If it’s forming after a downtrend, think reversal setup.
- If it’s forming in the middle of an uptrend, think continuation setup.
Watch the volume.
- Declining volume during the wedge is healthy.
- Spiking volume on the breakout confirms strength.
Measure potential targets.
- A common method is to measure the widest part of the wedge (from the top resistance to the bottom support when the wedge started forming).
- Add that distance to the breakout point to estimate the target.
Confirm with other tools.
- RSI divergence (price making lower lows while RSI makes higher lows) adds confidence.
- Support/resistance levels outside the wedge can refine targets and stops.
Trading Strategies with the Falling Wedge in Crypto
Here’s the fun part: how to actually use this pattern to make trades.
1. Classic Breakout Entry
Entry: Go long when the price breaks above the resistance line of the wedge.
Stop-loss: Just below the most recent swing low inside the wedge.
Target: Use the measured move (the wedge’s widest part added to the breakout point).
Example: If ETH forms a falling wedge on the daily chart and breaks out at $1,700 with a wedge height of $200, you’d aim for $1,900 as a first target.
2. Aggressive Pre-Breakout Entry
Entry: Enter near the bottom of the wedge when price approaches support.
Stop-loss: Just below the support line.
Target: Ride the move up toward resistance, then through the breakout if it happens.
This strategy is riskier but offers better reward if the wedge resolves as expected.
3. Add-On After Confirmation
Entry: Wait for the breakout and then add to your position after a retest of the broken resistance (now turned support).
Stop-loss: Below the retest level.
Target: Same measured move approach or key resistance zones above.
This is more conservative and filters out some false breakouts.
4. Combining with RSI or MACD
Pairing the falling wedge with an oscillator makes it more reliable:
RSI bullish divergence: Price makes lower lows while RSI makes higher lows. Great confirmation.
MACD crossover: A bullish MACD cross near the wedge breakout adds conviction.
5. Scaling Out on the Way Up
Because crypto can be volatile, it’s smart to take profits in stages:
First target: Near-term resistance or measured move.
Second target: Higher resistance or Fibonacci level.
Leave a small portion running in case momentum really takes off.
Examples in Crypto Markets
Bitcoin 2020: Before the epic bull run, BTC formed a falling wedge between March and May 2020. The breakout around $9,000 kicked off the surge to $12,000 and beyond.
Ethereum 2021: During the summer consolidation, ETH created a textbook falling wedge on the daily chart around $1,700. Breakout sent it toward $3,000.
Altcoins: Smaller coins often display falling wedges after big corrections. Traders who spot them early can ride massive rebounds.
Bottom Line
The falling wedge is one of those patterns that looks counterintuitive at first—you see price going down and yet it’s setting up for a bullish breakout. But once you understand how it works, it becomes a powerful tool in your trading toolkit.
Like anything in crypto, don’t use it in isolation. Combine it with solid risk management, volume analysis, and other indicators. That’s how you filter the high-probability setups from the noise.
In short:
- Spot the converging trend lines.
- Watch for declining volume.
- Wait for the breakout with confirmation.
- Trade with discipline.
Do that, and the falling wedge can go from “just another shape on the chart” to a reliable setup that helps you catch some of the market’s best moves.