Patterns are the bread and butter of technical traders. They help us make sense of the chaos in price charts and give us structure when volatility runs wild. One of the most underrated continuation patterns out there is the bullish rectangle, a formation that tells you the bulls are catching their breath before making another push higher.
If you’re into crypto trading, this pattern is worth adding to your toolkit. In this article, we’ll break it all down: what the bullish rectangle is, how to identify it, the pros and cons, how to interpret it, and some practical crypto trading strategies built around it.
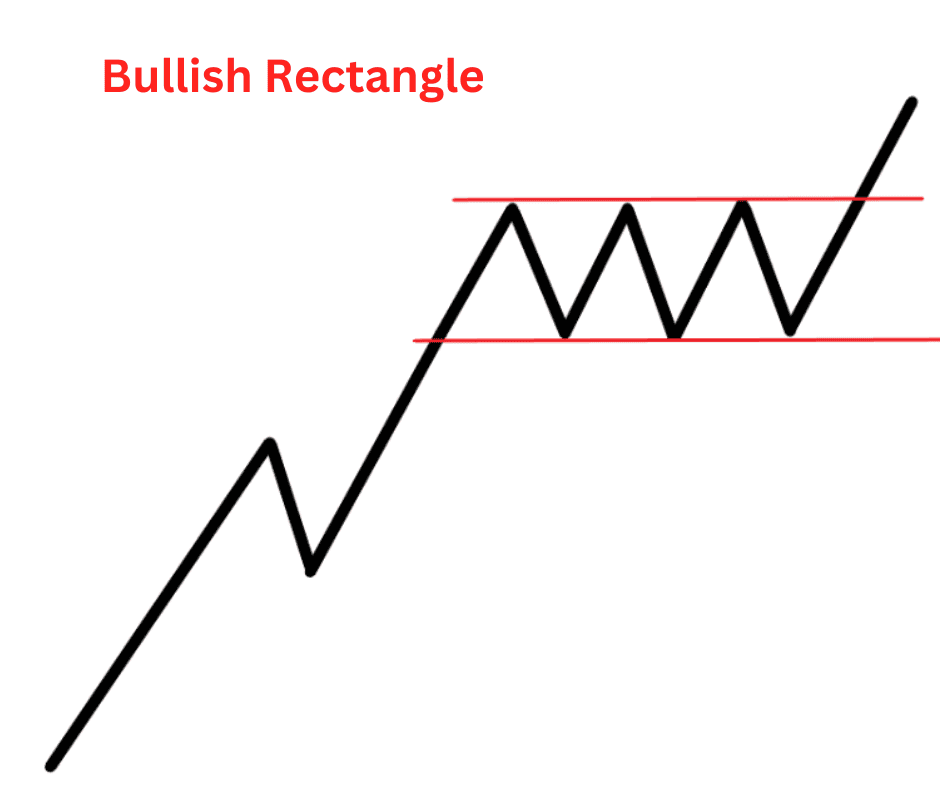
What Is the Bullish Rectangle Pattern?
A bullish rectangle is a continuation pattern. That means it forms in the middle of an uptrend, not at the start or the end. It looks like price gets stuck in a sideways box—trading between two parallel horizontal levels—before eventually breaking out to the upside.
Think of it like this: bulls are already in control, but after a strong rally, they pause. Sellers step in to cap the move, and buyers don’t push further—for now. Price bounces back and forth between support and resistance, building pressure. When the balance tips, the breakout usually continues in the direction of the prior trend: upward.
In short: the bullish rectangle is a pause, not a reversal. It’s the market catching its breath before sprinting again.
How to Identify It
Spotting this pattern is pretty straightforward once you know the key features.
Step 1: Confirm the prior trend
The bullish rectangle must come after an uptrend. If there’s no bullish move beforehand, it’s not a bullish rectangle—it’s just a sideways range.
Step 2: Spot the rectangle shape
The price consolidates between two horizontal lines:
Resistance (the top line): The highest price where sellers consistently push back.
Support (the bottom line): The lowest price where buyers reliably step in.
The price bounces inside this box multiple times. Usually, at least two touches on both the top and bottom levels are needed to validate the rectangle.
Step 3: Watch the volume
Volume often drops during the consolidation phase. Then, as the breakout approaches, volume typically spikes again—this is the fuel for the next leg upward.
Step 4: Breakout confirmation
The pattern is only confirmed once the price breaks above the resistance line with strong momentum (ideally on higher volume).
Components of the Bullish Rectangle
- Prior uptrend – sets the stage.
- Parallel support and resistance – the “walls” of the rectangle.
- Price oscillations inside – showing temporary balance between bulls and bears.
- Breakout to the upside – the actual signal to trade.
The pattern begins with a prior uptrend, which serves as the foundational context. This preceding bullish movement indicates strong buying interest and sets the tone for the
consolidation phase that follows.
Once the uptrend stalls, the price begins to move sideways, forming a well-defined range between two horizontal boundaries. These are the parallel support and resistance levels, which act as the “walls” of the rectangle. This reflects a market in equilibrium, where neither bulls nor bears dominate.
Within this range, the price oscillates between support and resistance, creating a series of highs and lows that remain confined within the rectangle. This phase represents a temporary balance between bullish and bearish forces, often driven by market indecision, profit-taking, or consolidation of gains. Volume may decline during this period, further emphasizing the lack of directional conviction.
Eventually, the pattern resolves with a breakout to the upside, which is the key signal. The breakout marks the end of consolidation and the continuation of the original uptrend, often leading to a sharp and sustained move.
Pros and Cons of the Bullish Rectangle Pattern
Pros
- Clear and simple: Easy to recognize, even for beginners.
- Reliable continuation signal: When confirmed, it often leads to solid upward moves.
- Gives defined levels: Support and resistance are obvious, making it easier to plan entries and stops.
- Works across time frames: You can spot it on 1-hour, daily, or weekly charts.
Cons
- False breakouts: Crypto loves to fake traders out. Sometimes the price breaks out of the rectangle only to snap back inside.
- Patience required: The rectangle can drag on for a while, which frustrates impatient traders.
- Not standalone: Without confirmation from volume, trend, or other indicators, the rectangle can mislead.
- Risk of reversal: Though it’s a continuation pattern, markets don’t always play by the book. A breakdown below support can flip the setup bearish.
How to Interpret the Bullish Rectangle
When you see a bullish rectangle, think of it as accumulation. Buyers are quietly loading up, while sellers are trying to slow things down. The sideways movement is like a coiled spring.
Here’s how to interpret different scenarios:
1. Classic Breakout
Price breaks above resistance with high volume. This is the textbook bullish rectangle outcome, suggesting the uptrend will resume.
2. False Breakout
Price spikes above resistance but quickly falls back into the rectangle. This often traps breakout traders. Smart traders wait for confirmation (like a daily candle close above resistance or sustained momentum).
3. Breakdown Below Support
Less common, but it happens. If price cracks support with conviction, the bullish rectangle morphs into a bearish signal. In crypto, fakeouts can be brutal, so always protect your downside.
Measuring the Target
One useful trick: measure the height of the rectangle (distance between support and resistance). Then, project that distance upward from the breakout point to estimate a potential target.
Example:
Support = $24,000
Resistance = $26,000
Rectangle height = $2,000
Breakout at $26,000 → Target = $28,000
Trading Strategies Using The Bullish Rectangle Pattern
Now let’s put this pattern into action. Here are some strategies crypto traders use with bullish rectangles.
1. Breakout Trading
Setup: Identify the rectangle in an uptrend.
Plan: Place a buy order just above resistance.
Execution: Enter when price breaks out with strong momentum and volume.
Risk Management: Put your stop-loss just below support (or slightly under the rectangle).
Example: Bitcoin rallies from $40k to $46k, consolidates between $46k and $48k. A breakout above $48k with strong volume could trigger a long entry targeting $50k–$52k.
2. Retest Trading (Safer Play)
Setup: Wait for the breakout.
Plan: Don’t jump in immediately. Wait to see if the price pulls back to retest the old resistance (now acting as support).
Execution: Enter on the successful retest.
Risk Management: Place your stop just below the new support.
Example: ETH breaks out above $1,800 after a rectangle. Price dips back to retest $1,800, holds, and then rallies. That retest gives a safer entry.
3. Range Trading (Pre-Breakout)
Setup: Price is still stuck inside the rectangle.
Plan: Trade the range—buy near support, sell near resistance.
Execution: Enter with small positions since the breakout direction isn’t confirmed yet.
Risk Management: Tight stops, since a breakout could wreck this approach.
Example: SOL consolidates between $20 and $22. You long at $20.20 with a stop at $19.80, aiming to sell near $22.
4. Leveraging the Height Projection
Setup: Confirmed breakout.
Plan: Measure the rectangle height and project upward.
Execution: Use this target for taking partial profits.
Example: ADA trades between $0.40 and $0.45. Rectangle height = $0.05. Breakout at $0.45 → target $0.50.
5. Combine With Indicators
RSI: If RSI stays healthy (not overbought) during the rectangle, it suggests the trend has room to run.
MACD: A bullish crossover during breakout adds confirmation.
Volume Profile: If volume picks up at breakout, it’s stronger evidence the move will stick.
Key Takeaways
The bullish rectangle is one of those “don’t overthink it” patterns. It’s literally price moving sideways in a box during an uptrend before continuing upward. But don’t let the simplicity fool you—it’s a reliable continuation signal if you trade it with discipline.
For crypto traders, the rectangle’s beauty lies in its flexibility:
- You can trade the breakout aggressively.
- You can wait for the retest for a safer entry.
- You can even range-trade inside the box if you’re careful.
The key is patience and confirmation. Don’t chase every move outside the rectangle—crypto loves to fake you out. Use volume, support/resistance, and indicators to confirm. And always protect your downside with stops, because even the best-looking bullish rectangle can turn bearish in a flash.
Master this pattern, and you’ll have one more weapon for spotting continuation setups in Bitcoin, Ethereum, or your favorite altcoin.