If you’ve been staring at candlestick charts long enough, you’ve probably noticed those mysterious blank spaces – those areas where price seems to jump, leaving a “gap” between candles. In traditional markets, gaps are common due to after-hours trading. But in crypto, which trades 24/7, gaps are rarer and often more meaningful. When they show up, they can be powerful signals—if you know how to read them.
Let’s break down what gap candlestick patterns are, how to spot them, what they mean, and how you can use them to sharpen your crypto trading game.
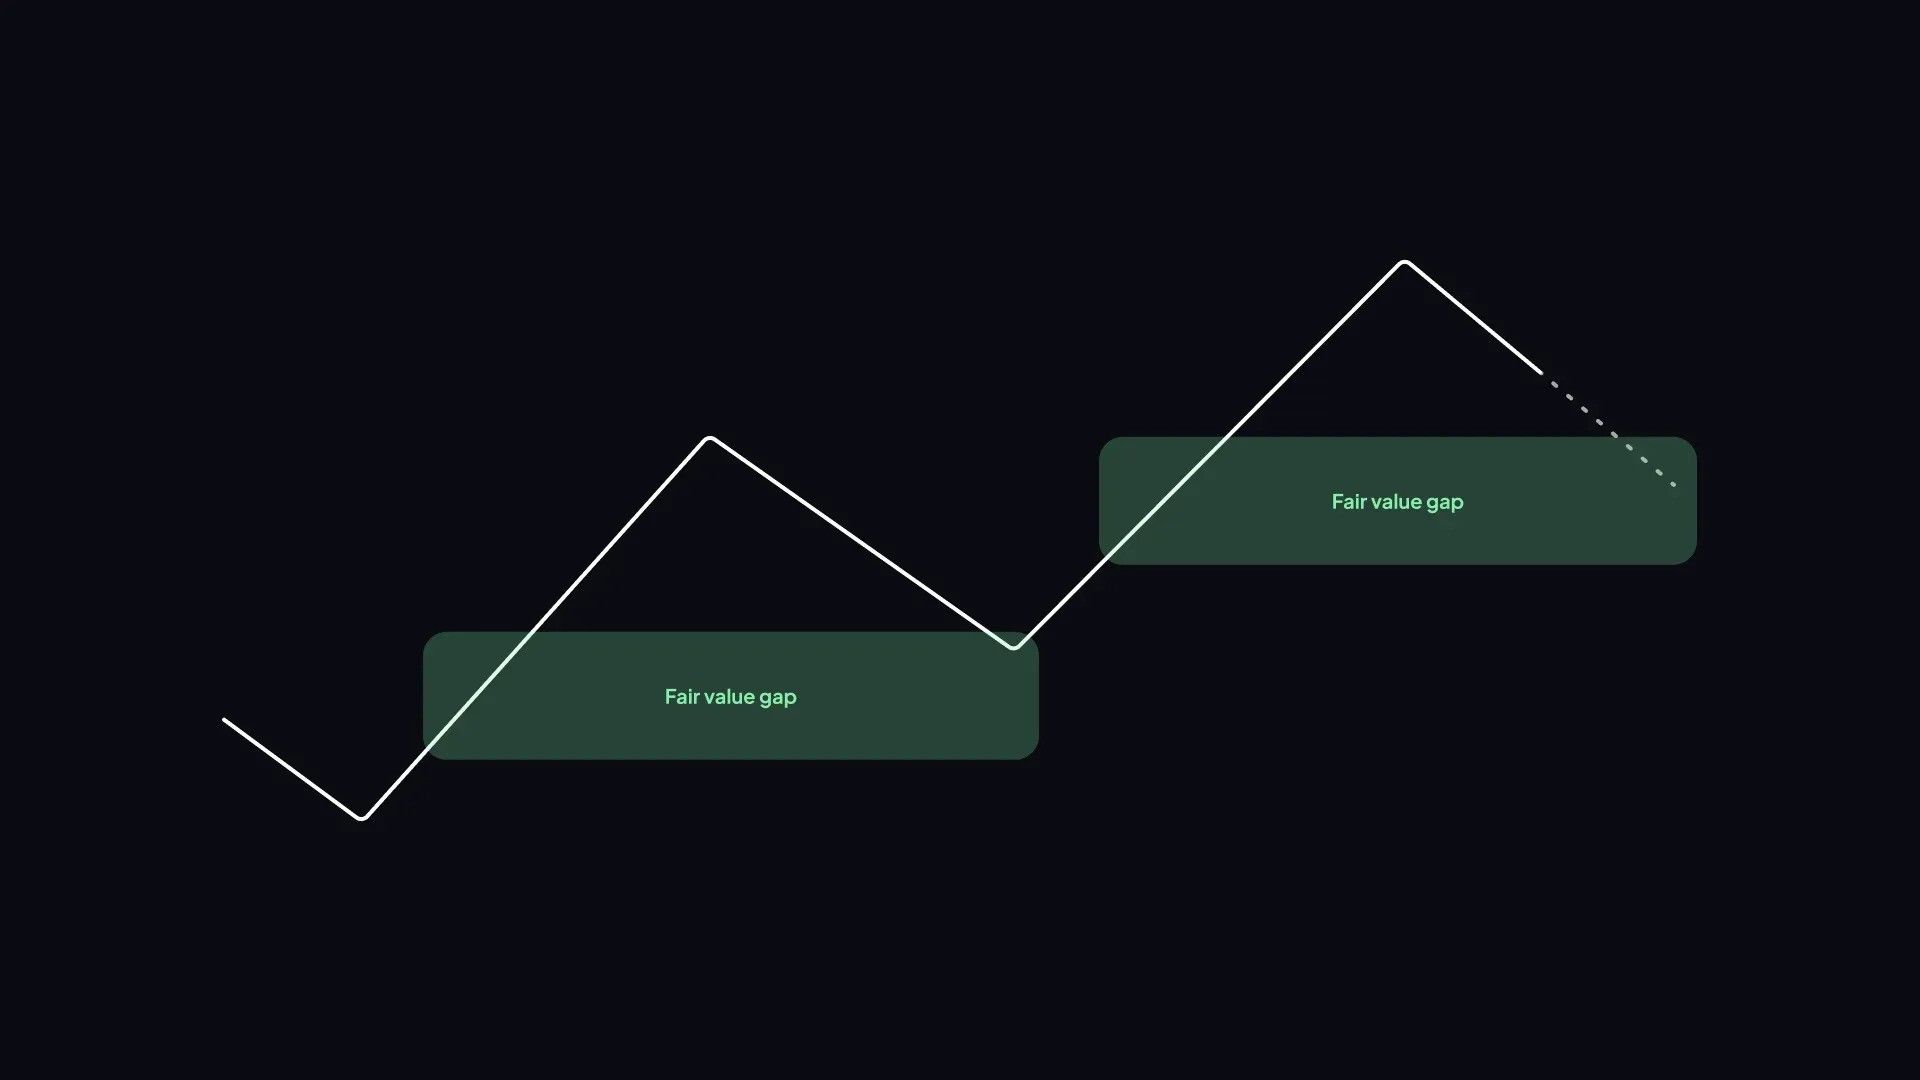
What Is the Gap Candlestick Pattern?
A gap candlestick pattern occurs when the opening price of a candlestick is significantly higher or lower than the closing price of the previous one, leaving a visible space, or “gap”, on the chart. This gap represents a sudden shift in market sentiment, often driven by news, whale activity, or a surge in trading volume.
In crypto, gaps are less frequent than in stock markets, but they do happen—especially on lower-volume altcoins or during high-volatility periods. When they do, they can signal trend reversals, breakouts, or exhaustion.
There are four main types of gap patterns:
- Common Gap: Random and usually insignificant. Often filled quickly.
- Breakaway Gap: Appears at the start of a new trend. Signals strong momentum.
- Runaway (or Continuation) Gap: Occurs in the middle of a trend. Confirms trend strength.
- Exhaustion Gap: Shows up near the end of a trend. Warns of a potential reversal.
Each type tells a different story, and knowing which one you’re looking at is key.
How to Identify It
Spotting a gap is easy once you know what to look for. Here’s how to break it down:
1. The Gap Itself
Look for a clear space between the closing price of one candle and the opening price of the next.
In crypto, gaps are more visible on daily or 4-hour charts, especially on exchanges with lower liquidity.
2. Volume Confirmation
A gap accompanied by high volume is more reliable.
Low-volume gaps can be misleading or short-lived.
3. Trend Context
Is the market trending up, down, or sideways?
Gaps in trending markets are more meaningful than those in choppy, range-bound conditions.
4. Candlestick Shape
Long-bodied candles with small wicks often indicate conviction.
Doji or spinning tops near a gap may suggest indecision.
5. Follow-Up Candles
Confirmation comes from what happens next.
A strong candle in the direction of the gap adds credibility.
Pros and Cons of the Gap Candlestick Patterns
Pros
- Clear Signals: Gaps often indicate strong sentiment shifts.
- Early Entry: Breakaway gaps can help you catch new trends early.
- Trend Confirmation: Runaway gaps validate ongoing momentum.
- Reversal Alerts: Exhaustion gaps can warn you to exit before a trend collapses.
Cons
- False Signals: Not all gaps lead to sustained moves.
- Hard to Spot: In crypto, gaps are less frequent and can be subtle.
- Requires Context: Without volume or trend analysis, gaps can mislead.
- Risky Entries: Jumping in too early can lead to losses if the gap gets filled.
Bottom line: gaps are powerful, but they’re not magic. Use them as part of a broader strategy.
How to Interpret the Gap Candlestick
Let’s decode each type of gap and what it’s trying to tell you:
Breakaway Gap
Where: At the start of a new trend.
What it means: Market is breaking out of a consolidation zone.
How to trade: Enter in the direction of the gap. Use volume and trend indicators for confirmation.
Runaway Gap
Where: In the middle of a strong trend.
What it means: Momentum is accelerating.
How to trade: Add to existing positions. Use trailing stops to ride the wave.
Exhaustion Gap
Where: Near the end of a trend.
What it means: Buyers or sellers are running out of steam.
How to trade: Take profits or prepare for a reversal. Look for bearish or bullish reversal patterns nearby.
Common Gap
Where: Anywhere, usually in low-volume zones.
What it means: Noise. Often gets filled quickly.
How to trade: Usually ignored unless supported by other indicators.
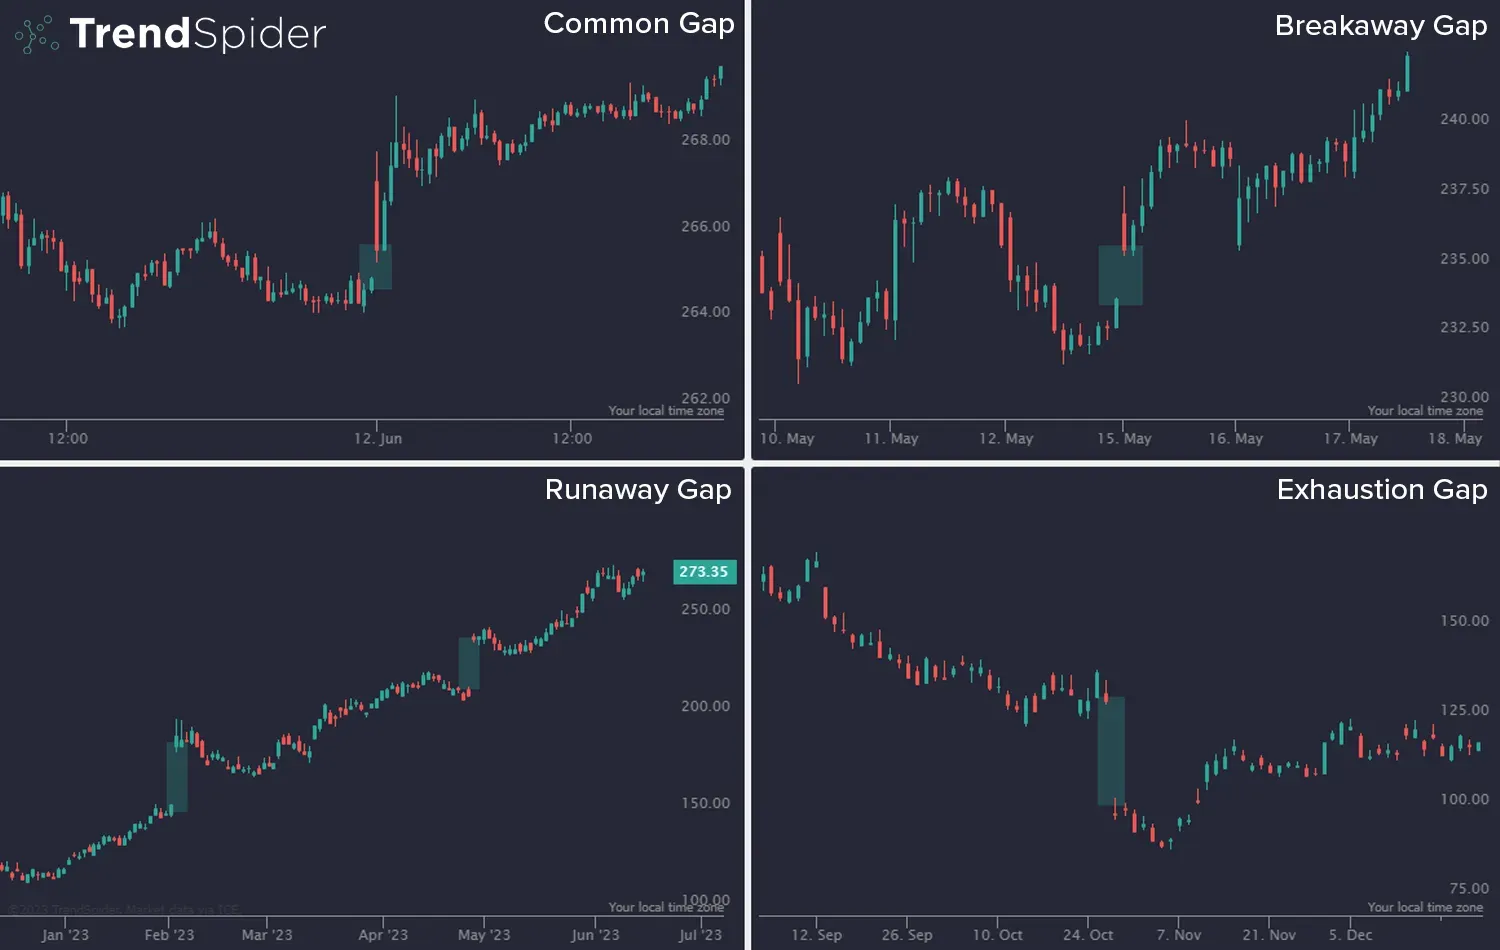
Source: TrendSpider
Trading Strategies Using Gap Candlestick Patterns
Here are a few strategies that incorporate gap candlestick patterns in crypto trading:
1. Breakaway Gap Momentum Strategy
Setup: Identify a breakaway gap after a consolidation phase.
Indicators: Use RSI, MACD, or Bollinger Bands to confirm breakout.
Entry: Buy at the open of the gap candle or on the next candle if volume confirms.
Stop Loss: Below the gap or recent support.
Take Profit: Use Fibonacci extensions or previous resistance levels.
2. Runaway Gap Trend Rider
Setup: Spot a gap in the middle of a strong uptrend or downtrend.
Indicators: Confirm with moving averages (e.g., 20 EMA crossing 50 EMA).
Entry: Add to your position after the gap candle closes strong.
Stop Loss: Below the last swing low (for longs) or high (for shorts).
Take Profit: Trail your stop to lock in gains as the trend continues.
3. Exhaustion Gap Reversal Play
Setup: Identify a gap after a long trend, especially if RSI is overbought/oversold.
Indicators: Look for bearish engulfing or bullish reversal candles.
Entry: Enter opposite to the trend once reversal is confirmed.
Stop Loss: Above/below the gap.
Take Profit: Target previous support/resistance zones.
Example: A meme coin pumps from $0.005 to $0.03 in two weeks. A massive upward gap forms at $0.035, but volume fades quickly. Traders short or sell expecting a retracement.
4. Gap Fill Scalping
Setup: Spot a common gap on lower timeframes.
Theory: Many gaps get “filled” as price retraces.
Entry: Enter in the direction of the fill (i.e., short if gap up, long if gap down).
Stop Loss: Tight stop above/below the gap.
Take Profit: At the previous candle’s close.
Pro Tips for Crypto Traders
- Use Multiple Time Frames: gaps on higher timeframes carry more weight.
- Watch Volume: high volume = conviction. Low volume = caution.
- Combine with Indicators: gaps work best with trend tools like RSI, MACD, and moving averages.
- Don’t Chase: wait for confirmation. FOMO is your enemy.
- Backtest: practice spotting and trading gaps on historical charts before going live.
Key Takeaways
Gap candlestick patterns might not be as common in crypto as in stocks, but when they appear, they’re worth paying attention to. Whether you're looking to catch a breakout, ride a trend, or spot a reversal, gaps can offer valuable clues—if you know how to read them.
So next time you’re scanning your charts and see a price jump that left a void, don’t just shrug it off. Zoom in, check the volume, analyze the context, and ask yourself: is this a gap worth trading?