Crypto traders love a good bounce. The problem is that not every bounce loves you back. Sometimes the market throws out a move that looks like the start of a recovery, gets traders excited, lures in fresh liquidity, then collapses again. That move is known as a dead cat bounce.
The name is dark, but the idea is simple. A market in a strong downtrend will sometimes pop up for a short time before continuing its drop. This pop can trick traders into thinking a reversal is starting. In reality, it is often nothing more than sellers taking profits, shorts covering, or traders overreacting to short-term news before the downtrend resumes.
Crypto markets see this pattern all the time, partly because sentiment swings fast and partly because volatility exaggerates every move. Understanding how the dead cat bounce forms, how to spot it, and how to trade it can save you money and sometimes even make you money.
Let’s break it down in a clear structure so you can use the pattern instead of getting trapped by it.
What Is the Dead Cat Bounce Pattern
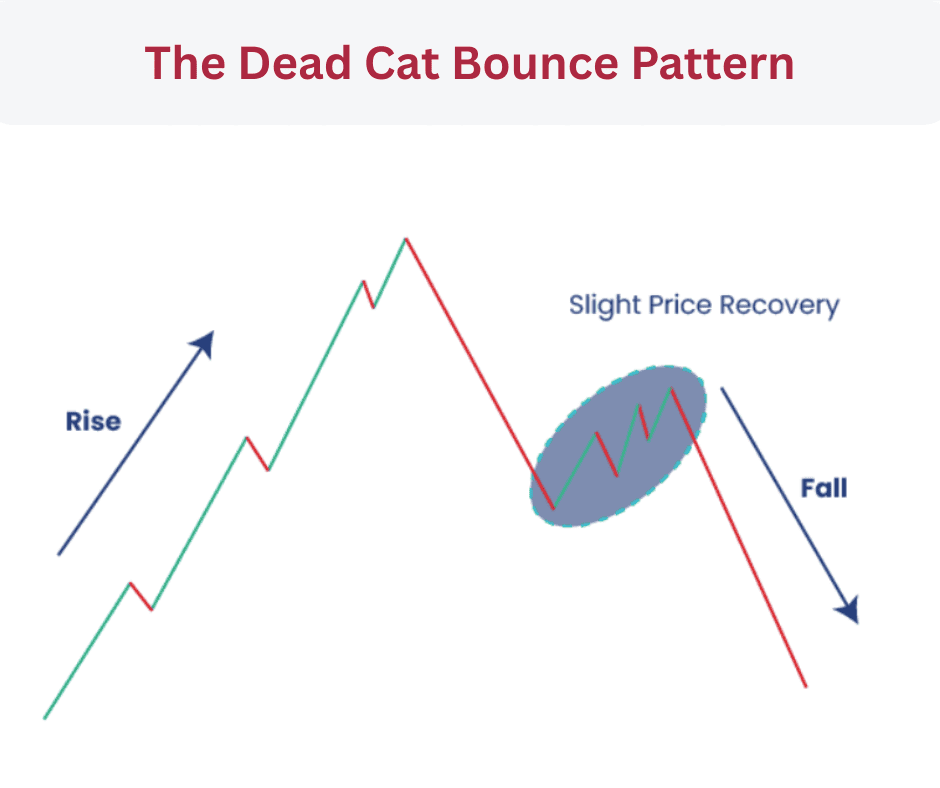
A dead cat bounce is a temporary recovery during an overall downtrend. Price falls hard, rebounds a bit, then continues dropping. That rebound is the bounce.
The psychology behind it is important. When price drops sharply, some traders close short positions to lock in profits, which adds buying pressure. Dip buyers also try to catch a bottom. At the same time, any positive headline, rumor, or influencer optimism can spark quick relief rallies. The result is a move upward that looks strong for a moment, but only because the market was oversold or reacting emotionally.
After the bounce, the real trend reasserts itself. Sellers return with force, long positions get trapped, and the trend continues lower.
The dead cat bounce is not only a chart pattern. It is a behavior pattern. It is the market showing you that emotion is still high, trends are still strong, and the crowd is still reactive.
How to Identify It and Its Components
Identifying the dead cat bounce is mostly about recognizing context. The bounce itself means nothing if you do not look at what came before it. Here are the core components.
1. A Sharp and Significant Decline
The pattern always starts with a strong drop. The fall needs to be large enough to shake the market and to produce oversold conditions. In crypto this might be a 10 percent drop during slow markets or a 25 percent slide during high volatility.
Volume helps confirm this move. Big red candles with above average volume show real selling pressure, not just algorithmic drift.
2. A Sudden Bounce or Mini Rally
After the drop, price rallies. This rally should be noticeable but not dramatic. The key is that it feels convincing enough to pull traders back in, yet weak enough to break again.
On a chart this often shows up as a few green candles retracing roughly 10 to 40 percent of the initial drop. Anything stronger might signal a real reversal rather than a dead cat bounce.
3. Weakness During the Bounce
The bounce often shows:
- Decreasing volume while price goes up.
- Lower highs compared to the previous structure.
- Momentum indicators like RSI moving up from oversold but still staying below midline.
- No real shift in market sentiment.
- Strong reversals have energy. Dead cat bounces look tired.
4. Continuation of the Downtrend
The drop that follows the bounce is what confirms the pattern. Once price loses the support that formed during the bounce or breaks a key level, the pattern becomes clear. Traders who bought the bounce get squeezed out, which amplifies the next leg down.
5. Time Frame Considerations
On shorter time frames a dead cat bounce can form within hours. On daily charts, it can last days or weeks. The psychology is the same. The only difference is how long traders stay hopeful before reality hits.
Pros and Cons of the Dead Cat Bounce Pattern
Pros
1. Clear trend continuation structure
Dead cat bounces keep you aligned with the major trend. They help traders stay on the right side of momentum instead of fighting it.
2. Good entries for short positions
For traders who short, the bounce creates ideal entries with defined risk. Instead of chasing price down, you wait for a controlled rally and then enter when strength fails.
3. Useful for risk management
Knowing this pattern exists can stop you from buying prematurely. Many traders lose money trying to catch bottoms in markets that keep falling. Recognizing a potential dead cat bounce helps you stay patient.
4. Works across coins and time frames
Bitcoin, altcoins, memecoins, microcaps,it doesn’t matter. The pattern appears everywhere because the psychology behind it is universal.
Cons
1. Hard to identify in real time
It is easy to call a dead cat bounce once the chart is complete. It is harder while the market is still moving. That uncertainty requires discipline.
2. Sharp reversals can invalidate the pattern
Sometimes the bounce turns into a genuine recovery. Markets love to fake traders out. If a positive catalyst hits, the dead cat bounce setup can reverse before anyone reacts.
3. High volatility can hit stop losses fast
Crypto moves fast. Even clean setups can get wicked out. Traders need to expect random price spikes and unpredictable noise.
4. News events can override the pattern
A bounce during a downtrend is not always a trap. Sometimes it is the start of an important shift. Failing to adapt can put you on the wrong side of the market.
How to Interpret the Pattern
Interpreting the dead cat bounce means reading the strength of the bounce in context with the bigger trend. Look for these signals:
1. Check Volume
Low volume on the bounce signals weak demand. Big sellers are not threatened and likely waiting to hit the next level.
If volume surges but price barely moves, that is another red flag. It shows the bounce is fighting heavy sell pressure.
2. Watch Key Levels
Support and resistance levels reveal if the bounce has any real strength. If price fails to break a major resistance level or gets rejected at a simple moving average, odds of a dead cat bounce increase.
Common levels to watch:
- 20-day and 50-day moving averages.
- Previous range lows.
- Key psychological prices like 2000 for ETH or 70000 for BTC.
- Horizontal support turned resistance.
3. Assess Market Sentiment
Sentiment is often irrational during downtrends. People want to believe the bottom is close. If social media turns optimistic after a minor bounce while fundamentals have not changed, it may be a trap.
4. Use Momentum Indicators
Indicators should support the idea of weakness.
- RSI rising from oversold but staying below 50 shows a weak rebound.
- MACD failing to cross bullishly or crossing but flattening fast hints at limited momentum.
- OBV staying flat or dropping reveals persistent selling pressure.
5. Compare Coins
Crypto often moves in clusters. If Bitcoin is in a strong downtrend and its bounce looks weak, but altcoins are popping harder, that is usually noise. The dead cat bounce is stronger when the entire market shows the same behavior.
Crypto Trading Strategies Using the Dead Cat Bounce Pattern
Here are some straightforward strategies traders use when dealing with this pattern. These are not financial advice but well known approaches in the trading community.
1. Shorting the Bounce at the Retest of Resistance
This strategy is simple. Wait for the initial crash, let the bounce form, then look for price to retest a key resistance level. If price rejects that level with weak volume, traders enter a short position with a stop loss above the resistance.
This approach works well on Bitcoin because BTC often respects major moving averages after strong drops.
2. Using Fibonacci Retracements
Many traders watch retracement levels during bounces. Dead cat bounces often stall around:
- 0.382 retracement
- 0.5 retracement
If price taps these levels and rejects with strong sell volume, traders enter short positions targeting the previous low or lower support.
3. Waiting for Breakdown Confirmation
More conservative traders avoid predicting the top of the bounce. Instead, they wait for the bounce to fail and for price to break back below its short-term support.
Once the support breaks, traders enter short positions using the nearest lower high as the stop.
4. Pair Trading Between Strong and Weak Coins
When the entire market is in a downtrend, some coins bounce harder than others. Traders may short the weak ones after the bounce while avoiding the strong ones. This reduces risk and takes advantage of relative weakness.
5. Using Funding Rate Shifts
On futures markets, funding rates reveal trader positioning. If funding spikes positive during a weak bounce, it shows traders are going long aggressively at the worst time. Many traders use this as a signal to fade the bounce.
6. Laddering Out of Long Positions
Not every strategy involves shorting. Long term holders sometimes use dead cat bounces to exit positions with less damage. In a major downtrend, bounces are often the best chance to reduce exposure without panic selling.
Final Thoughts
The dead cat bounce is one of the most common patterns in crypto trading. It appears in every market cycle and across all time frames. The key to using it well is context. The pattern works when the broader trend is strong, sentiment is shaky, and the bounce looks weak. It fails when a real reversal or catalyst hits.
The best traders treat it as a tool, not a signal carved in stone. Watch volume. Track levels, study momentum, and match your strategy to your risk level. And remember that every bounce has a story. Your job is to read it clearly.