Broadening wedges are one of those chart patterns that traders tend to either love or avoid. They look chaotic, they feel unpredictable at first glance, and they often show up right when the market starts acting loud. But once you know what you’re looking at, this pattern can actually help you read volatility instead of fearing it.
Read below to find out what the broadening wedge is, how to identify it, what it brings to the table, where it falls short, and how to use it in real trading.
If you want a pattern that reveals when the market is stretching its extremes and teasing a potential reversal or breakout, this one is worth adding to your toolkit.
What Is a Broadening Wedge Pattern
A broadening wedge is a price pattern that looks like a megaphone pointed to the right. Instead of price tightening into a triangle, the swings grow wider. Highs get higher, lows get lower, and volatility expands.
This expansion is the core idea. The market is becoming more emotional, more aggressive, and less balanced. Buyers push higher highs, sellers force lower lows, and neither side seems ready to calm down.
There are two main types:
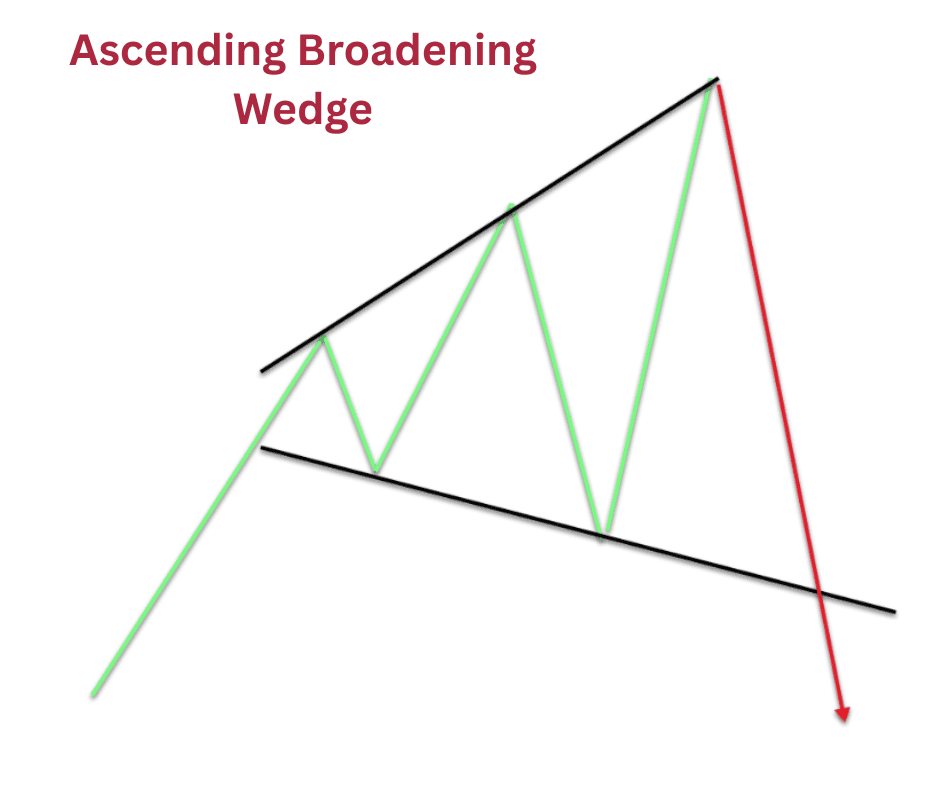
- Broadening rising wedge: Both trend lines expand upward. Highs keep rising and lows also rise but at a slower pace. It often signals exhaustion and can lead to a bearish reversal.
- Broadening falling wedge: Both trend lines expand downward. Lows keep dropping and highs also rise but within the downward slant. This often suggests selling pressure is getting tired and can lead to a bullish breakout.
The pattern can appear during trends or during chaotic sideways phases. In crypto, broadening wedges show up more often than in traditional markets.
How to Identify It
Spotting a broadening wedge is easier than it looks once you know what to check.
1. Two Expanding Trend Lines
You need at least two higher highs on the top side and two lower lows on the bottom side. Connect the highs, connect the lows, and watch the lines spread apart. The important part is the expansion. The range needs to widen.
If the lines move toward each other, that is a triangle. If only one side expands while the other stays flat, that is a different structure. The wedge is defined by price making bigger swings on both sides.
2. Increasing Volatility
This is the giveaway. Volatility should rise as the pattern develops. The swings stretch wider, and candles often grow larger. Think of it as the market turning up the volume.
3. A Real Contest Between Buyers and Sellers
Unlike trends that move with purpose, broadening wedges show a tug of war. Neither side holds control for long. New highs get rejected, new lows get snapped up. The market is unsure, and that uncertainty creates opportunity.
4. A Clear Breakout Point
The pattern ends when price breaks one of the trend lines with conviction. A clean breakout can signal the next significant move. This breakout can either align with the existing trend or flip the trend entirely.
5. Time and Validation
You want at least four to five touches between the two lines to confirm the wedge. A single bounce or a couple of dramatic candles are not enough. The wedges that matter have structure.
Pros and Cons of the Broadening Wedge Pattern
Pros
1. Early Warning of Volatility Expansion
Many traders chase breakouts too late. Broadening wedges tell you when volatility is heating up. That gives you a chance to plan before the crowd wakes up.
2. Strong Breakout Potential
Because the pattern builds around emotional swings, the breakout often comes with force. Crypto loves explosive moves, and broadening wedges tend to feed that behavior.
3. Can Signal Reversals and Continuations
The pattern does not lock you into one type of outcome. A rising broadening wedge often hints at bearish reversals, while a falling broadening wedge often hints at bullish reversals. In some cases, especially during strong trends, the pattern can still continue the same direction.
4. Works on Multiple Time Frames
From short-term scalps to higher timeframe swing trades, the pattern scales well. Crypto’s liquidity makes the structure appear even on lower timeframes.
Cons
1. It Looks Messy
This is the most common complaint. The pattern feels chaotic and is hard to spot for newer traders. It can also be confused with random volatility.
2. Fake Outs Happen
Because the market is emotional during these formations, breakouts can fake traders out before the real move hits.
3. Late Entries Can Hurt
If you join after the breakout candle runs away, you can get trapped on a pullback. Timing matters more here than with cleaner structures.
4. Not All Wedges Break the Same Way
Unlike something like a textbook triangle, broadening wedges do not give a clear direction every time. You need context and confirmation.
How to Interpret the Pattern
Reading the pattern correctly is more important than simply spotting it.
1. Watch the Rhythm of the Swings
Ask yourself: Are buyers getting weaker with every new high? Are sellers losing conviction on each new low?
A rising wedge making sloppy, weak highs is often ready for a drop.
A falling wedge struggling to make fresh lows can be gearing up for a rally.
2. Look at Volume
Volume isn’t required, but it helps. Increasing volume during expansion suggests strong emotions. A breakout with strong volume is usually more reliable.
3. Identify Dominant Trend Context
If the market entered the wedge during a strong uptrend, a break upward is more likely unless the structure clearly shows exhaustion. If the trend entering the wedge was down, a break downward is more probable unless sellers are clearly fading.
4. Use Confirmation
Relying on the pattern alone can lead to frustration. Combine it with moving averages, RSI divergences, or even simple support and resistance levels. You want evidence, not hope.
5. Respect the Breakout Candle
The breakout candle often tells the truth. Strong body, clear direction, solid impulse. Weak breakouts deserve skepticism.
Crypto Trading Strategies Using the Broadening Wedge Pattern
Let’s turn the pattern into usable setups. Below are strategies crypto traders often rely on.
1. Breakout Entry Strategy
This is the classic approach.
-
How it works:
Wait for price to break the upper or lower trend line with a strong close. The breakout shouldn’t be a tiny wick. Enter as the candle closes or on a small pullback. -
Stop placement:
Below the breakout candle on upside breaks or above it on downside breaks. - Targeting: Use previous swing levels inside the wedge or Fibonacci extensions for bigger targets. Crypto tends to overshoot, so extended targets can pay well.
When it shines:
High volatility coins, news-driven moves, or momentum phases.
2. Reversal Strategy at the Extremes
This strategy uses the extremes of the wedge before the breakout even happens.
- How it works: When price reaches the top trend line of a rising wedge and shows rejection, take a short. When it hits the bottom trendline of a falling wedge with bounce signals, take a long.
This works best when you combine it with RSI divergence or weakening momentum.
- Stop placement: Just outside the trend line to protect against volatility spikes.
- Targeting: Aim for the opposite side of the wedge. Because the range widens, these can be strong intrawedge trades.
When it shines:
Choppy markets where breakouts keep failing.
3. Retest Strategy After Breakout
Some traders wait for the breakout and then the retest. It’s slower but often safer.
- How it works: Once price breaks the wedge, wait for it to return to the broken trend line. If the retest holds with a clean bounce, enter.
- Stop placement: Below the retest if buying or above it if selling.
- Targeting: Use swing highs or lows outside the wedge or measured moves based on the pattern size.
When it shines:
Markets that like to fake out before moving.
4. Pattern Failure Strategy
Broadening wedges fail often enough that you can trade the failure.
- How it works: If price breaks out but immediately gets pulled back inside the wedge, trade in the opposite direction. These failed moves can be powerful.
- Stop placement: Outside the failed breakout wick.
- Targeting: Opposite side of the wedge or more if momentum carries.
When it shines:
Low volume breakouts or confusing market phases.
Key Takeaways
Broadening wedges can feel intimidating because they look messy, but once you learn their rhythm, they become reliable signals of volatility expansion. They reveal emotional markets, give clues about trend exhaustion, and set the stage for strong breakouts.
Crypto traders who learn to read these patterns gain an advantage in timing entries, managing risk, and catching large moves before they fully take off. The key isn’t to rush but to let the pattern form, let the swings expand, and wait for the market to show its hand. When it does, a broadening wedge can be one of the cleanest ways to ride chaos with confidence.