Price action isn’t just random noise. Patterns emerge. Some are messy, some are clear as day, and some can be powerful tools if you know how to spot them. One of the most practical patterns out there is the price channel.
For traders who love technical analysis, the price channel is like having guardrails for your charts. It gives you structure in a market that often feels chaotic and can be a goldmine for timing entries and exits.
Let’s break down what it is, how to identify it, what it’s good (and not so good) for, and how actually to trade it in the wild world of crypto.
What Is the Price Channel Pattern?
A price channel is a chart pattern formed when an asset’s price consistently bounces between two parallel lines. Think of it as the price moving inside a tunnel: there’s a ceiling (resistance) on top and a floor (support) on the bottom.
When the price touches the top, it often pulls back. When it hits the bottom, it usually rebounds. As long as the price stays within the lines, you’ve got yourself a channel.
Price channels can tilt in three directions:
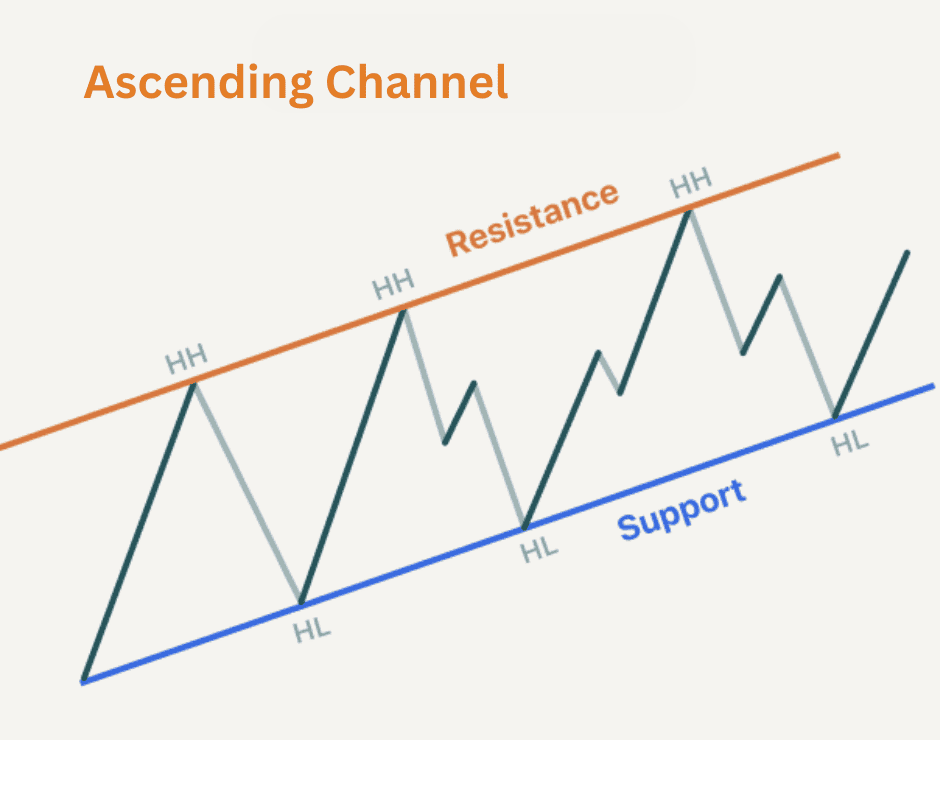
- Ascending channel – Price is trending upward with higher highs and higher lows.
- Descending channel – Price is trending downward with lower highs and lower lows.
- Horizontal channel (range-bound) – Price moves sideways, stuck between consistent support and resistance.
In crypto, where volatility is the name of the game, these channels show up all the time, whether you’re looking at Bitcoin on the daily chart or altcoins on a 15-minute time frame.
How to Identify the Price Channel
Spotting a price channel isn’t rocket science, but it does require a careful eye. Here’s what to look for:
1. Two Parallel Trend Lines
Draw a line connecting at least two significant highs and another line connecting at least two significant lows. If the lines are roughly parallel, you’re in channel territory.
2. The Upper Boundary (Resistance)
This is the top of the channel where price tends to stall or reverse. Think of it as the “ceiling” the asset keeps bumping into.
3. The Lower Boundary (Support)
This is the bottom of the channel where price finds a floor and often bounces back upward.
4. The Midline (Optional but Useful)
Many traders also draw a line through the middle of the channel. The price often reacts around this line; it’s like a gravity center within the channel.
5. Multiple Touch Points
The more times the price hits the boundaries without breaking out, the stronger the channel. If you only have one high and one low, it’s too early to call it a channel.
Pro tip: Use tools like TradingView’s trend line or parallel channel tool for precision.
Pros and Cons of the Price Channel Pattern
Like any trading tool, price channels aren’t foolproof. They come with strengths and weaknesses you’ll want to weigh before making moves.
Pros
- Clear entry and exit signals: The channel boundaries practically draw your buy and sell zones.
- Works across time frames: Whether you’re scalping or swing trading, channels adapt.
- Risk management made easier: Stop-loss placement is straightforward—just outside the channel lines.
- Identifies trend direction: Ascending vs. descending channels give you a quick read on market bias.
Cons
- False breakouts: Crypto markets love to fake you out. A breakout can quickly turn into a trap.
- Subjectivity: Drawing channels isn’t an exact science. Two traders might draw them slightly differently.
- Short lifespan in volatile markets: Channels can collapse fast when news or whales enter the picture.
- Not standalone: Relying only on channels without confirming signals (volume, indicators, candlestick patterns) can burn you.
How to Interpret It
So you’ve spotted a channel, what now? The interpretation depends on the channel type.
Ascending Channel
This indicates bullish momentum.
Traders look to buy at the lower boundary (support) and sell near the upper boundary (resistance). A breakout above the channel often signals continuation of the uptrend.
Descending Channel
This one suggests bearish momentum.
Shorting at the upper boundary and taking profit at the lower boundary is a common strategy. A breakout above resistance can signal a trend reversal.
Horizontal Channel (Range)
This type of channel shows that neutral trend price is consolidating.
Range traders love these because they can repeatedly buy low and sell high. A breakout in either direction signals the start of a new trend.
In every case, volume matters. Breakouts with strong volume are more trustworthy than those without. Weak volume = potential fakeout.
Crypto Trading Strategies Using the Price Channel
Now let’s get practical. Here are some trading strategies that use price channels effectively.
1. Buy Low, Sell High Within the Channel
In an ascending channel, buy when price touches the lower boundary.
Sell near the upper boundary.
Place stop-loss just below support (for longs) or above resistance (for shorts).
This strategy works best in well-established channels with multiple touchpoints.
2. Trade the Breakout
Sometimes the price doesn’t respect the channel forever—it breaks out.
Upside breakout: Enter a long trade if price closes above resistance with strong volume.
Downside breakout: Enter a short if price closes below support with conviction.
Confirm with indicators like RSI or MACD to avoid traps.
3. Use the Mid Line as a Guide
If you’ve drawn a midline, watch how price behaves around it.
In an uptrend, the midline often acts as dynamic support.
In a downtrend, it can act as resistance.
Trading pullbacks to the midline can provide early entries before the next leg.
4. Combine With Indicators
Price channels get even stronger when paired with indicators:
RSI: Overbought near the upper channel? Time to sell. Oversold near the lower boundary? Possible buy signal.
Volume: Look for spikes to confirm breakouts.
Moving Averages: If the MA lines up with a channel boundary, that support/resistance is extra solid.
5. Multi-Time Frame Confirmation
Spot a channel on the 1-hour chart.
Zoom out to the 4-hour or daily to see if it aligns with a bigger trend.
This prevents you from trading against the overall market flow.
Real-World Example: Bitcoin Channels
Bitcoin has a habit of forming beautiful channels. For instance, during its climb in late 2020, BTC often trended within ascending channels on both the 4-hour and daily charts. Traders who recognized the pattern could ride the support line upwards and take profit near resistance all the way up the rally.
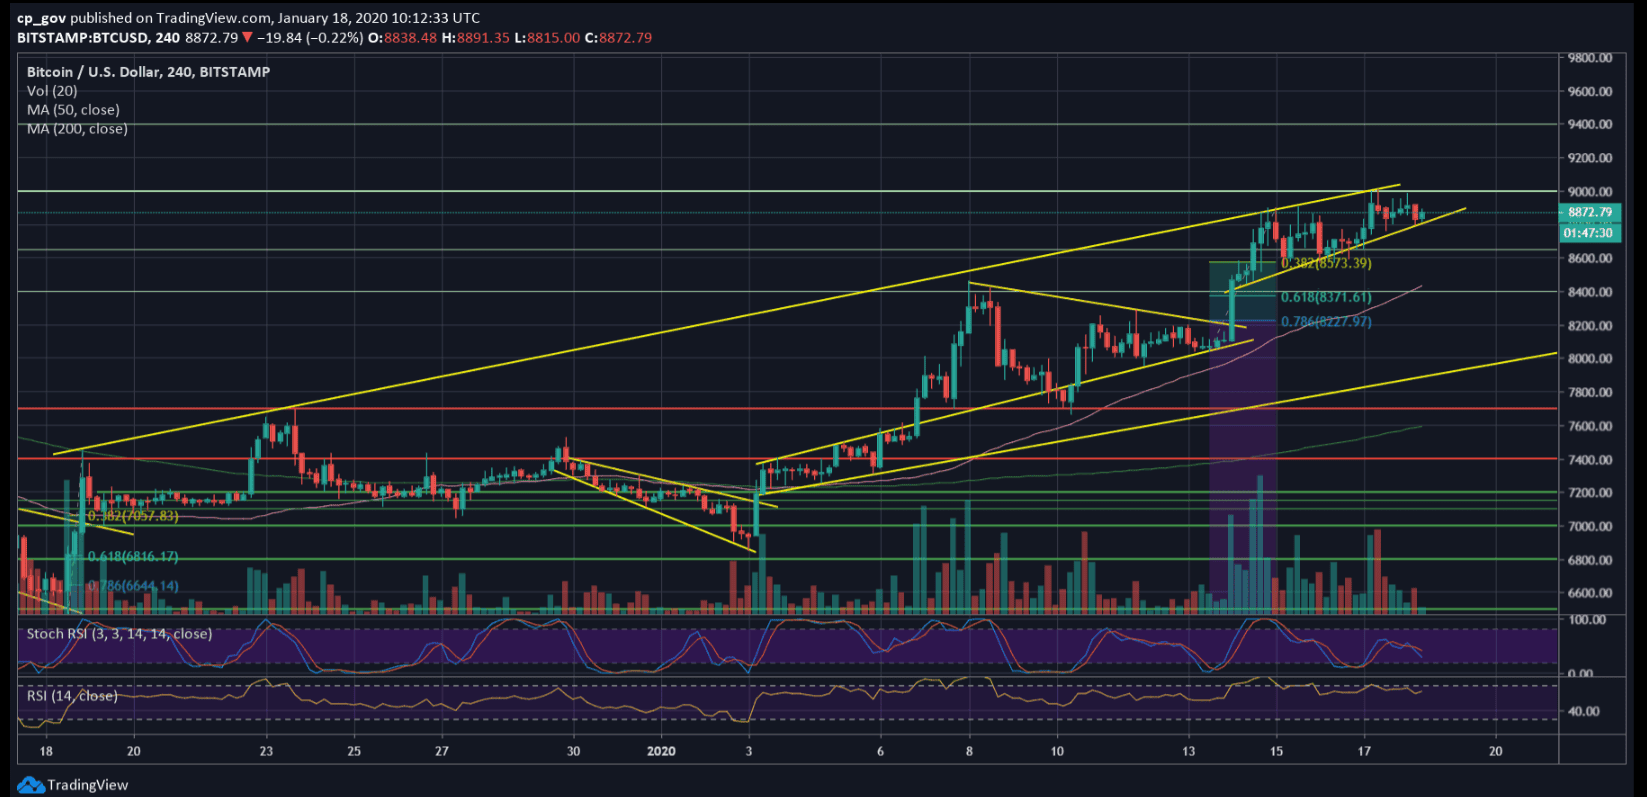
Source: CryptoPotato
On the flip side, altcoins like Solana or Cardano often create descending channels during corrections. For savvy traders, these channels can signal potential reversals once price breaks out upward.
Conclusion
The price channel pattern is one of the simplest but most effective tools in a crypto trader’s playbook. It gives you structure, helps you spot opportunities, and makes risk management more intuitive.
To recap:
- Channels are formed by parallel lines of support and resistance.
- They come in three flavors: ascending, descending, and horizontal.
- The pros: clarity, flexibility, and risk management. The cons: subjectivity and false breakouts.
- Strategies include trading within the channel, breakout plays, and combining with indicators for confirmation.
Like any technical tool, price channels work best when combined with other signals and solid risk management. Don’t treat them like a crystal ball—they’re more like a map. And in the unpredictable jungle of crypto markets, having a map is way better than wandering blind.