When it comes to crypto charts, you probably know by now that bottoms can be messy. Panic selling, wild swings, liquidation cascades; it’s not exactly a smooth ride. But sometimes, buried in that chaos, you’ll find a rare but powerful pattern: the diamond bottom.
This isn’t one of those patterns you see every other day. But when it does appear, it can be a trader’s signal that the tide is about to turn.
Let’s break it all down: what the diamond bottom is, how to identify it, the pros and cons, how to read it, and some trading strategies to put it to work.
What Is the Diamond Bottom Pattern?
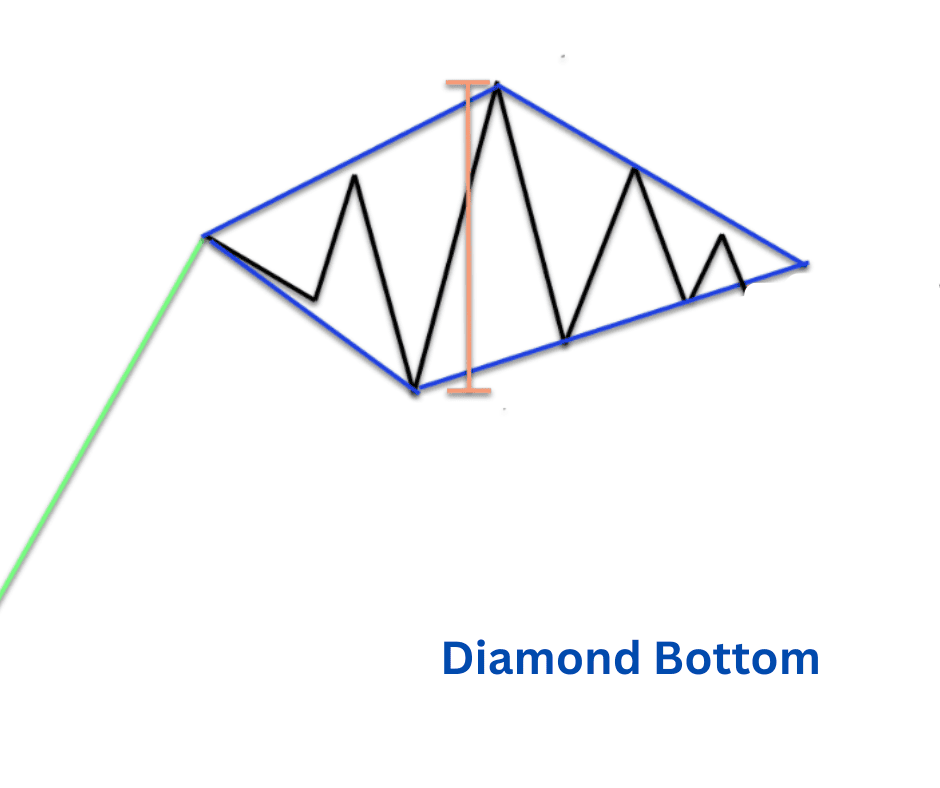
The diamond bottom is a bullish reversal pattern. It usually forms after a downtrend, when sellers are losing steam and buyers are starting to push back.
Visually, it looks like a diamond lying sideways at the bottom of the chart. The structure forms when volatility first expands (price swings get wider), then contracts (swings tighten). When price finally breaks out above resistance, that’s your bullish cue.
In plain terms: the diamond bottom signals that sellers have thrown everything they’ve got at the market, but the panic is fizzling. Buyers are regrouping, momentum is shifting, and an uptrend may be on deck.
How to Identify It
Catching a diamond bottom requires some chart-reading chops, because it can be mistaken for other bottoming patterns. Here’s the step-by-step anatomy:
1. Context Matters
The diamond bottom shows up after a clear downtrend.
If you don’t see a strong bearish move leading into it, don’t call it a diamond.
2. The Broadening Phase (Left Side)
After the downtrend, price starts swinging wildly.
Highs push higher, lows push lower.
The structure looks like a broadening wedge—volatility expands.
3. The Contracting Phase (Right Side)
The swings start to shrink.
Price makes higher lows and lower highs, forming a narrowing wedge.
This shift shows sellers losing dominance, buyers fighting back.
4. The Breakout
When price finally breaks above the upper resistance line of the diamond, that’s the bullish trigger.
Ideally, you want to see strong volume confirming the breakout.
Pro tip for crypto traders: Diamonds are easier to spot on mid- to high-time frames (4H, daily). On smaller timeframes, the constant noise of crypto trading can disguise or distort the pattern.
Pros and Cons of the Diamond Bottom Pattern
Like any trading tool, the diamond bottom isn’t a silver bullet. Let’s weigh the upsides and downsides.
Pros
- Powerful Reversal Signal – When legit, it often precedes strong rallies.
- Clear Entry Setup – The breakout above resistance gives a straightforward buy trigger.
- Favorable Risk-to-Reward – Stop-loss goes just under the pattern, while upside potential can be much bigger.
Cons
- Rare in the Wild – Diamond bottoms don’t appear often in crypto markets.
- Hard to Spot – Easy to confuse with double bottoms, inverse head-and-shoulders, or symmetrical triangles.
- Prone to Fakeouts – Crypto loves to trap traders with false breakouts. Diamonds are no exception.
How to Interpret the Diamond Bottom
When you see a diamond bottom forming, here’s the story the chart is telling:
Capitulation and Panic Selling
The left-side expansion shows sellers overshooting—panic-driven dumps and overextended wicks.
Shift in Momentum
As the right side contracts, the chaos calms. Sellers lose control, and buyers quietly start reclaiming ground.
Breakout Psychology
When resistance breaks, it’s more than just a line on the chart—it’s a collective shift. Short sellers cover, sidelined buyers jump in, and momentum snowballs upward.
Volume as the Truth Serum
Watch the volume. In a legit diamond bottom, volume often spikes during the breakout. Without that volume, the move might fizzle or reverse.
Trading Strategies Using the Diamond Bottom
Now the part you came for: how to actually trade this thing.
1. Classic Long on Breakout
Entry: Buy when price closes above the diamond’s upper resistance line.
Stop-Loss: Place it just under the last swing low inside the diamond.
Target: Aim for the first major resistance zone above or use Fibonacci extensions.
Example: ETH/USDT forms a diamond bottom at $1,000. Breakout happens at $1,050. Long entry there, stop at $980, target $1,250.
2. Aggressive Early Entry
Some traders anticipate the breakout and go long near the bottom of the contracting phase.
Bigger reward potential, but higher risk if the breakout fails.
Works best if volume and momentum indicators (like RSI divergence) hint at strength.
3. Retest Entry
Sometimes after the breakout, price comes back down to retest the old resistance (now support).
If it holds, that’s a high-confidence entry point.
Safer than jumping in on the first breakout candle.
4. Scalping the Noise
On shorter time frames, aggressive traders play the swings inside the diamond itself.
Risky but can pay off if you’re disciplined with stops.
Best for experienced scalpers who thrive in choppy markets.
Key Takeaways
The diamond bottom is a bullish reversal pattern, usually forming after a strong downtrend.
- It consists of two phases: a broadening, chaotic expansion followed by a contracting, coiling structure.
- The bullish signal comes when price breaks above resistance, ideally with strong volume.
- Pros: powerful reversal, clear setups, good risk-to-reward.
- Cons: rare, tricky to identify, vulnerable to fakeouts.
- Strategies include breakout longs, aggressive pre-breakout entries, retest buys, and short-term scalps.
Bottom line: the diamond bottom is one of those patterns you don’t see every week, but when it does appear, it can mark the start of explosive moves in crypto. If you’re serious about trading patterns, it’s worth adding to your toolkit.